
Platform Manual
This manual is a complete walkthrough of the Agentsflare tenant console (https://Your-slug.agentsflare.com). It is organized by function; every step includes the corresponding page screenshot.
The console supports both Chinese and English. Every screenshot in this manual is provided in two versions: English (suffix -en) and Chinese (suffix -zh).
1. Login
Open the console URL in your browser. Enter your account email and password, then click Login.
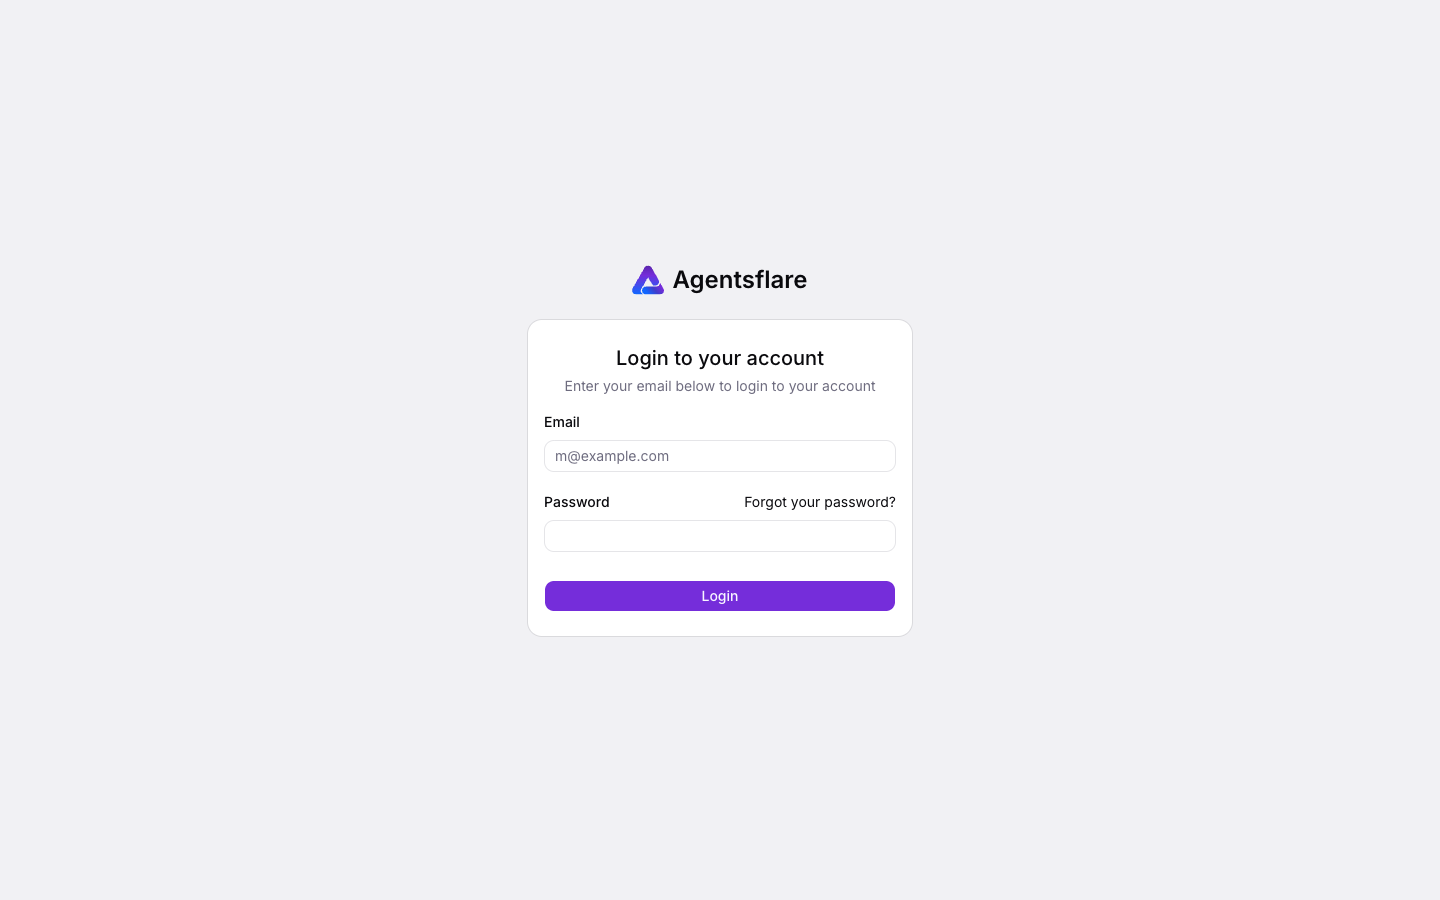
Figure 1: Login page
If you forget your password, click Forgot your password? to reset it.
2. Dashboard
After login you land on the Dashboard, which gives an at-a-glance view of your organization's usage.
The top row shows three summary cards:
- Total Cost — total spend in USD for the selected period.
- Total Tokens — total tokens consumed, split into Input and Output.
- Total Calls — total number of API requests.
Below the cards are trend charts (Cost Trend, Token Trend, Calls Trend) and four "Top 5" panels (Project Top 5, API Key Top 5, Model Top 5, Model Brand Top 5), each ranked by cost, tokens, and calls.
Use the filters at the top to narrow the view: the date-range selector (Today by default) and the Project / API Key / Model Brand / Model dropdowns.
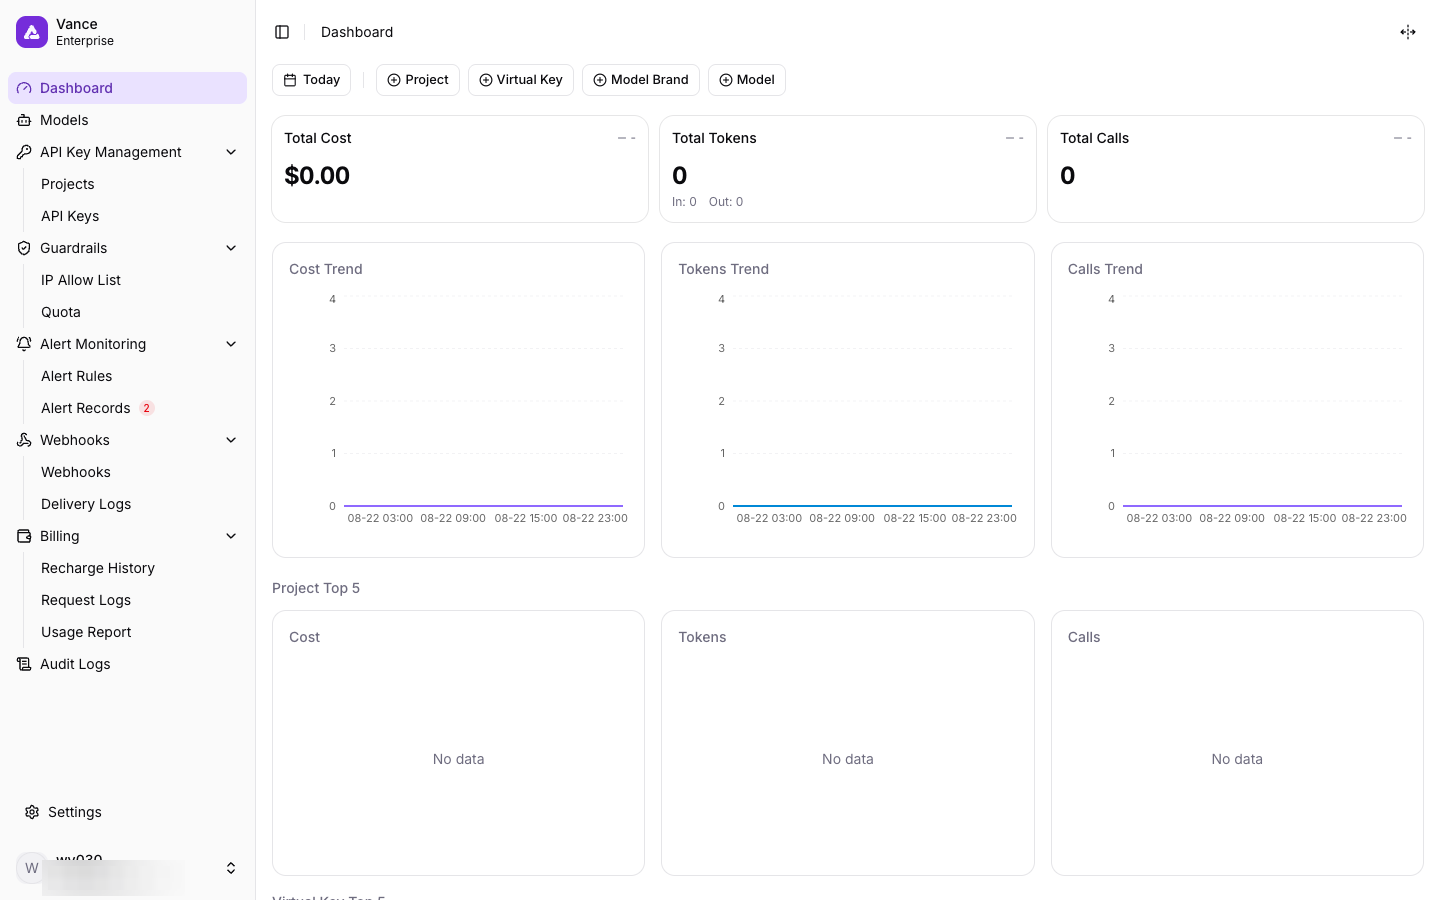
Figure 2: Dashboard
3. Models
The Models page lists every model available to your organization. Each row shows:
- Model ID — the model identifier used in API calls (click the copy icon to copy it).
- Brand — the model provider.
- Price Table — the pricing table the model belongs to.
- Release Date — when the model was made available.
- Context Length — the model's maximum context window.
- Output Limit — the maximum output tokens.
Use the search box to find a model by ID, the Brand filter to narrow by provider, and Columns to show/hide table columns.
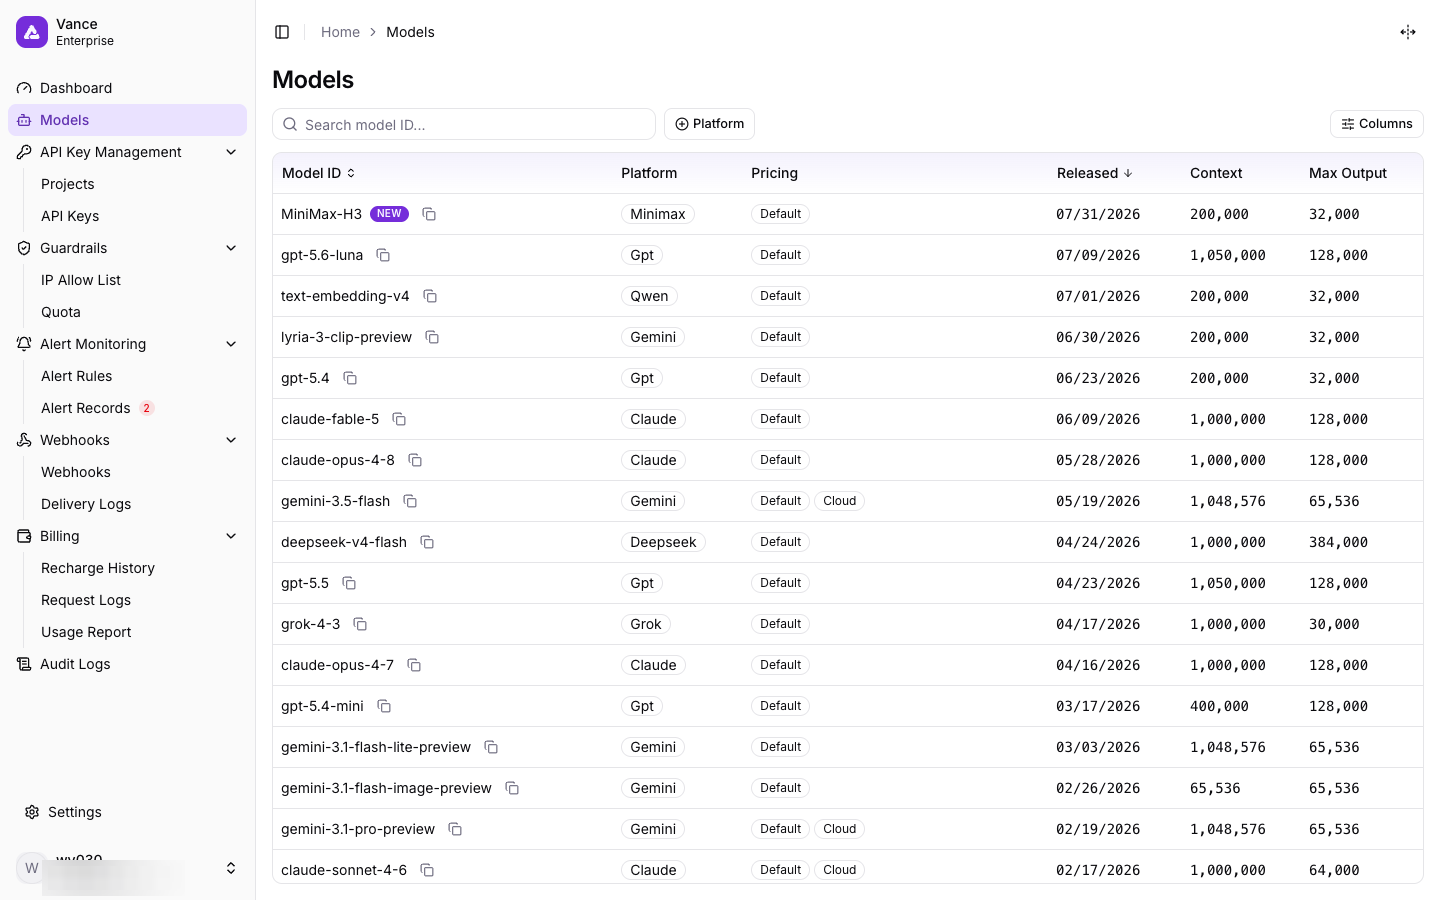
Figure 3: Models list
4. Project Management
Organizations can create multiple projects for different internal teams or products, providing resource isolation and independent cost accounting.
The Projects page lists all projects with their name, creation time, and the number of associated API Keys. Use the search box, Import / Export, and Columns as needed.
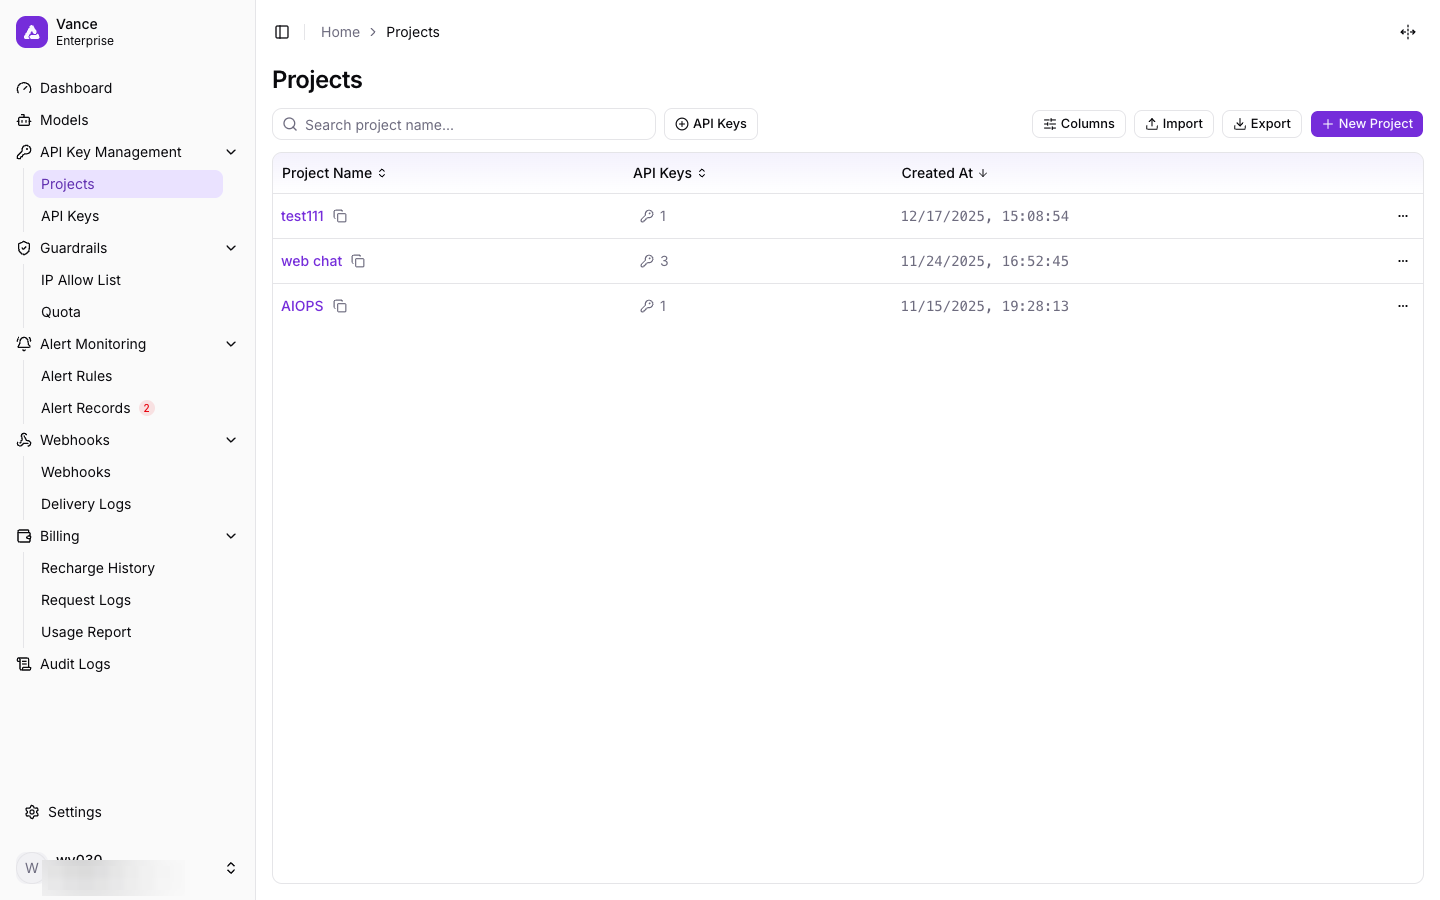
Figure 4: Projects list
Create a Project
Click New Project at the top of the Projects page.
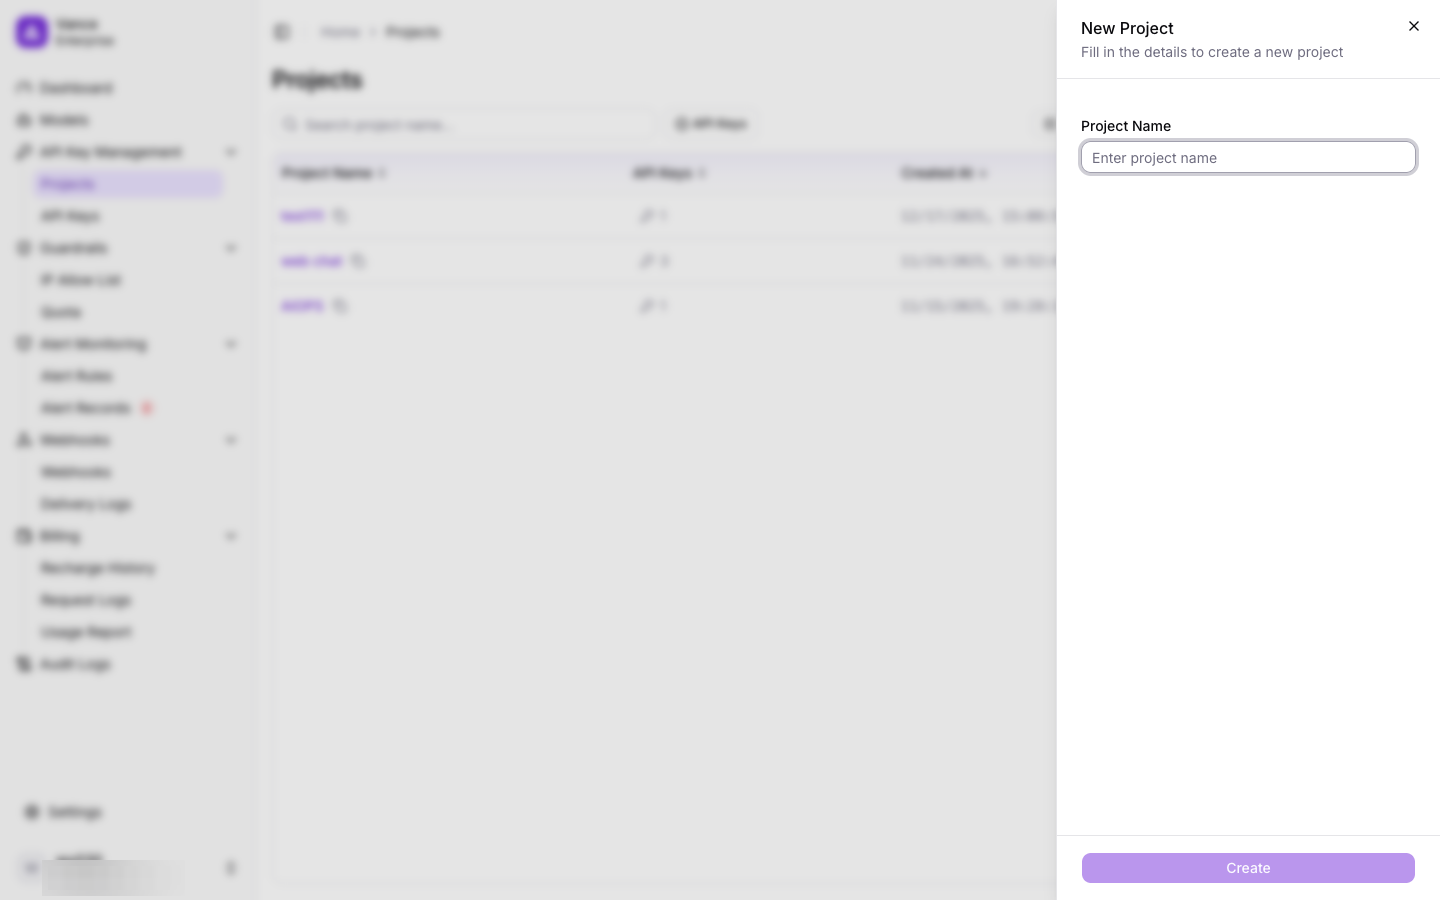
Figure 5: Create Project dialog
Enter a project name (for example "Project A") and click Create to create the project.
5. API Key Management
The API Keys page lists all API Keys. Each row shows the key name, the masked key value (sk-agf-...), the owning project, the model restriction, the expiration, and the creation time.
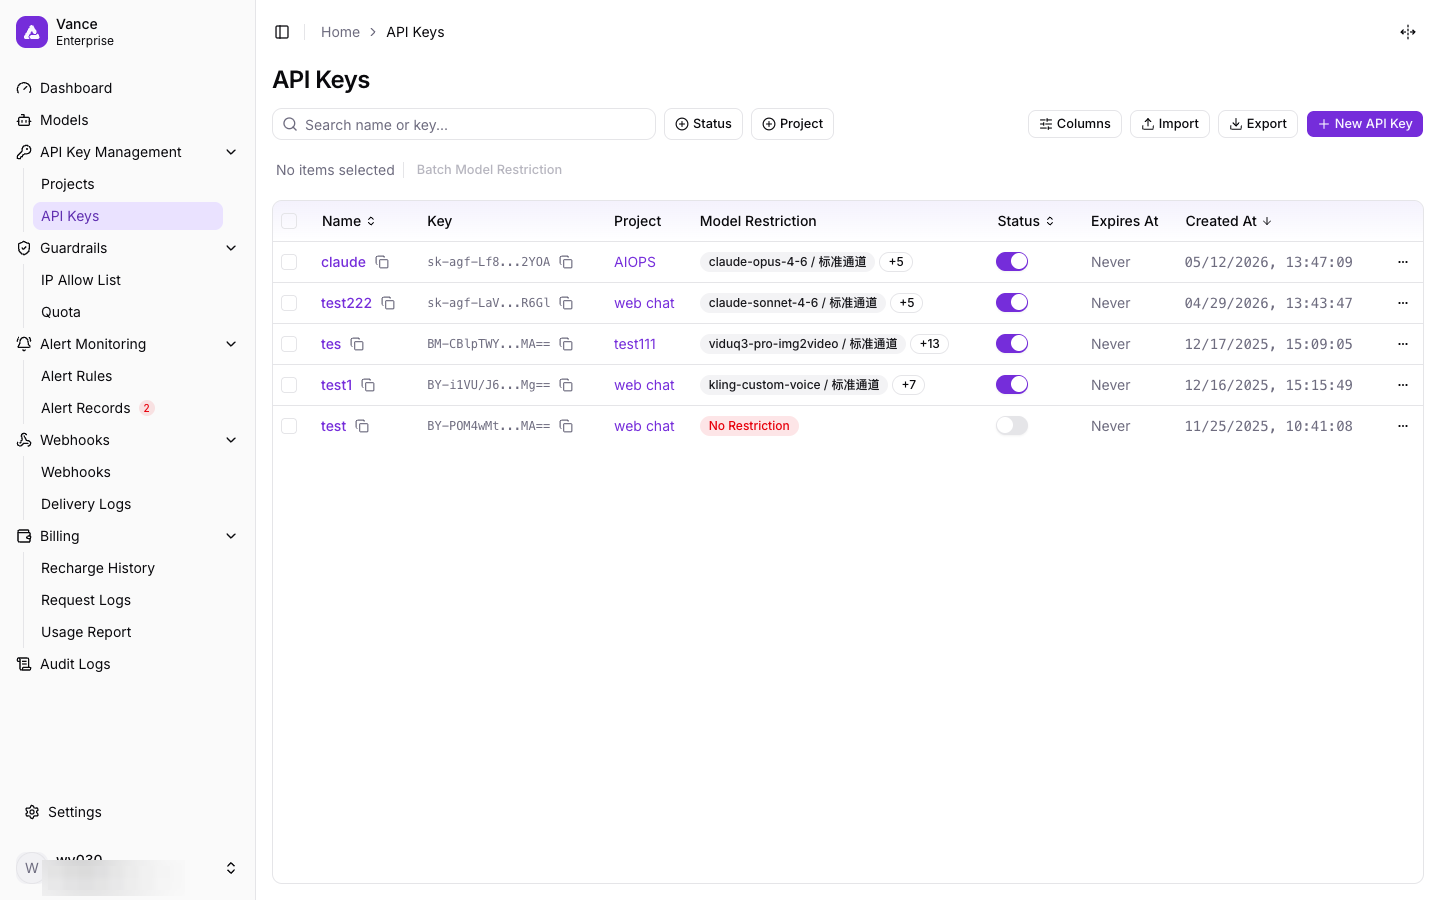
Figure 6: API Keys list
Note: API keys are project-level. The key value is only shown once when the key is created, so store it securely.
Create an API Key
Click New API Key.
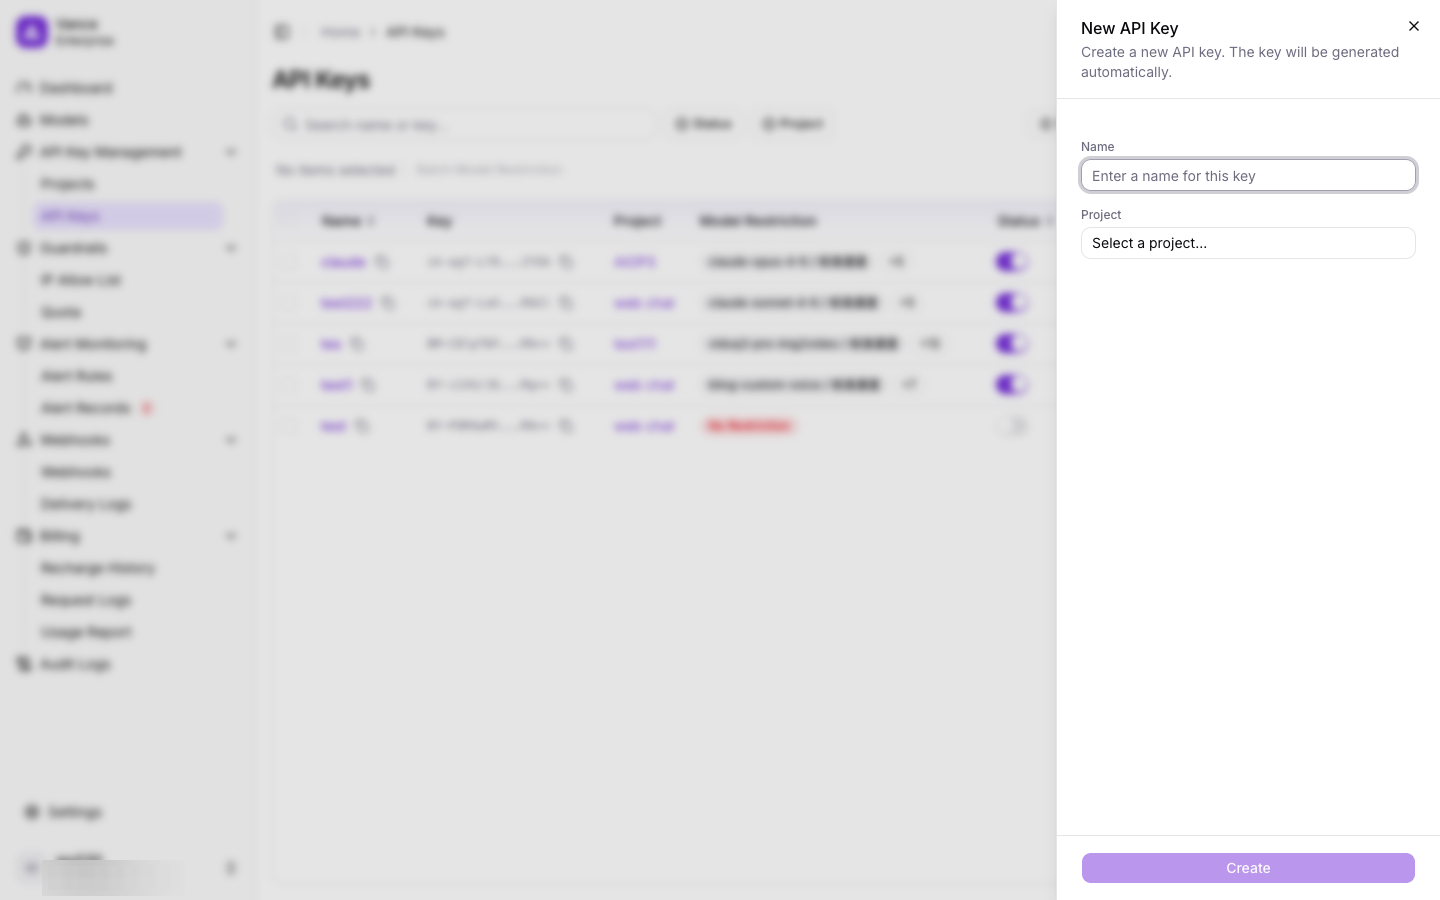
Figure 7: Create API Key dialog
Enter a name and select the owning Project. Click Create — the API Key value is generated automatically and returned once.
Edit an API Key
Click the row's Actions menu, then Edit to open the edit dialog, where you can change the name, status, and expiration time (leave the expiration empty to make it never expire). The dialog also shows creation/update timestamps and the change history.
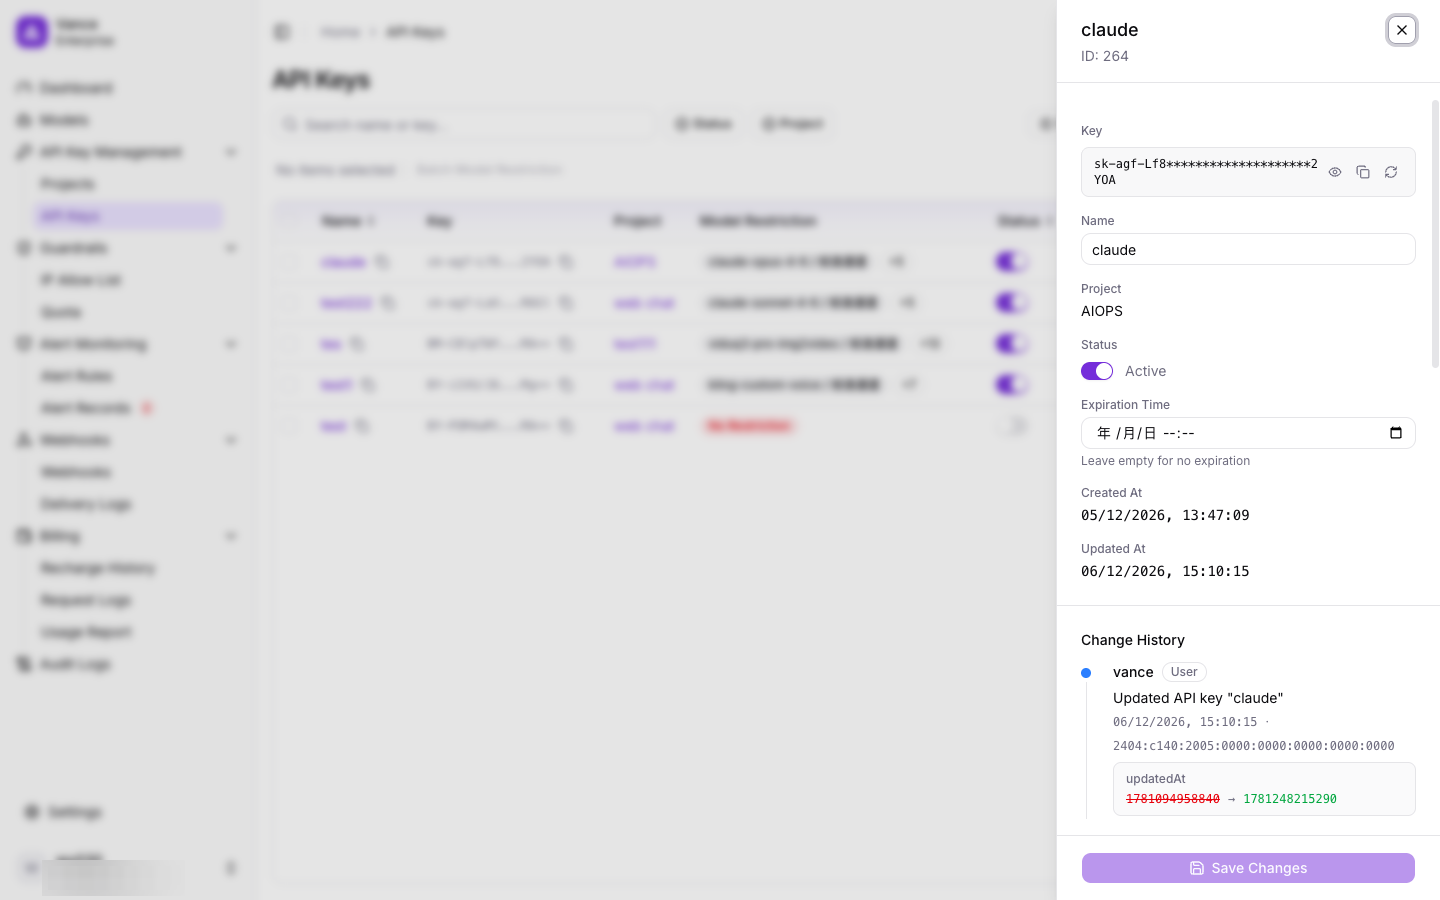
Figure 8: Edit API Key dialog
Configure Model Restriction
Click the model restriction value in a row (for example claude-opus-4-6 / ...) to open the Model Restriction dialog. Select which model–channel combinations this API Key is allowed to call, then click Save.
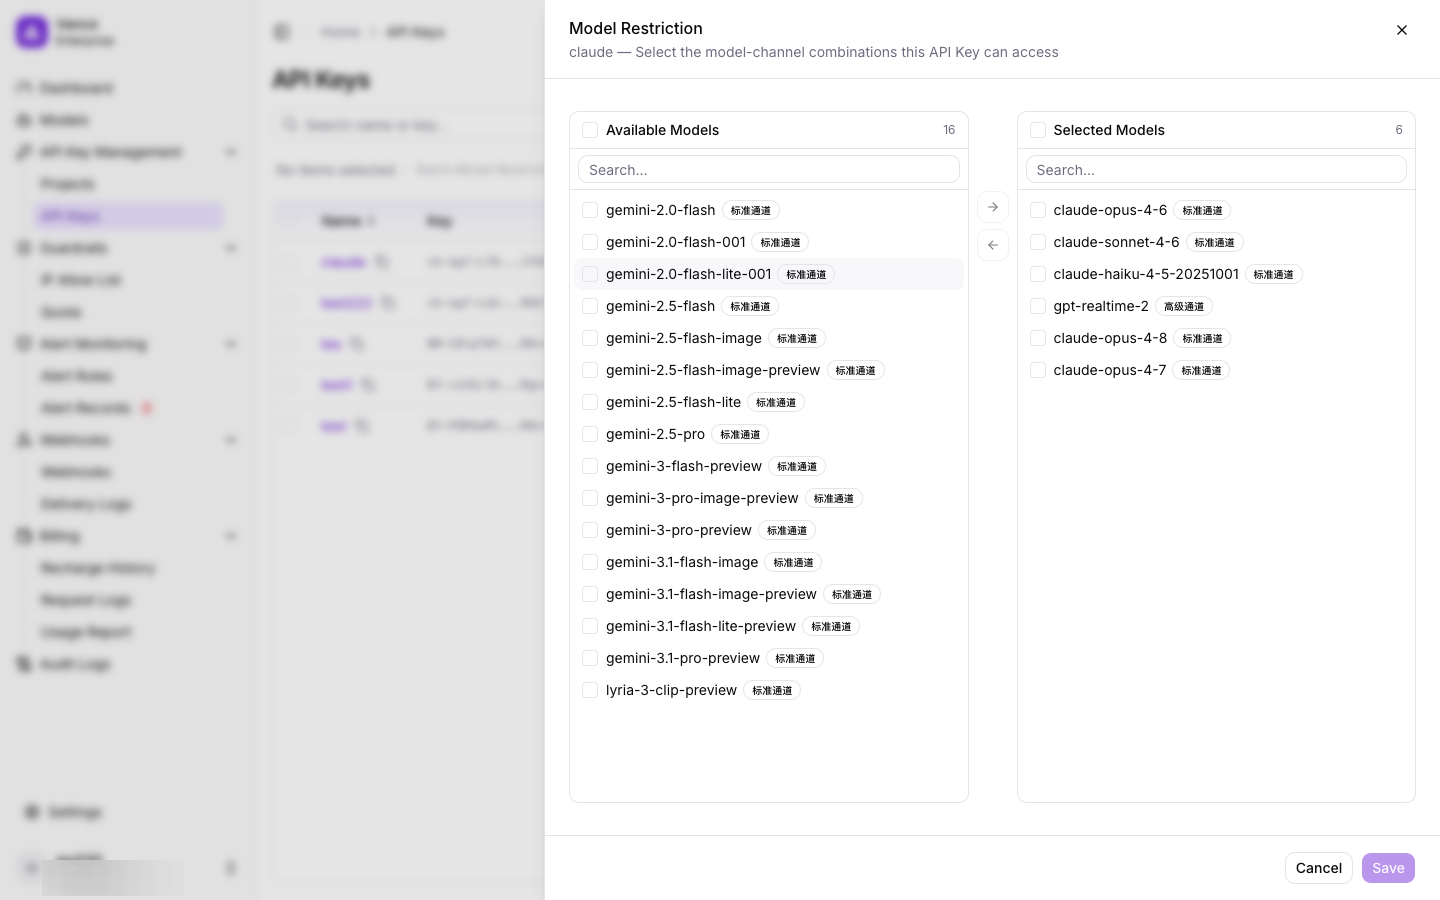
Figure 9: Model restriction (model–channel selection)
6. IP Whitelist
The IP Whitelist restricts API Key access to requests originating from specified IP addresses or CIDR ranges. It is a global setting: once configured, IP validation applies to all API requests. If the list is empty, no restriction is applied.
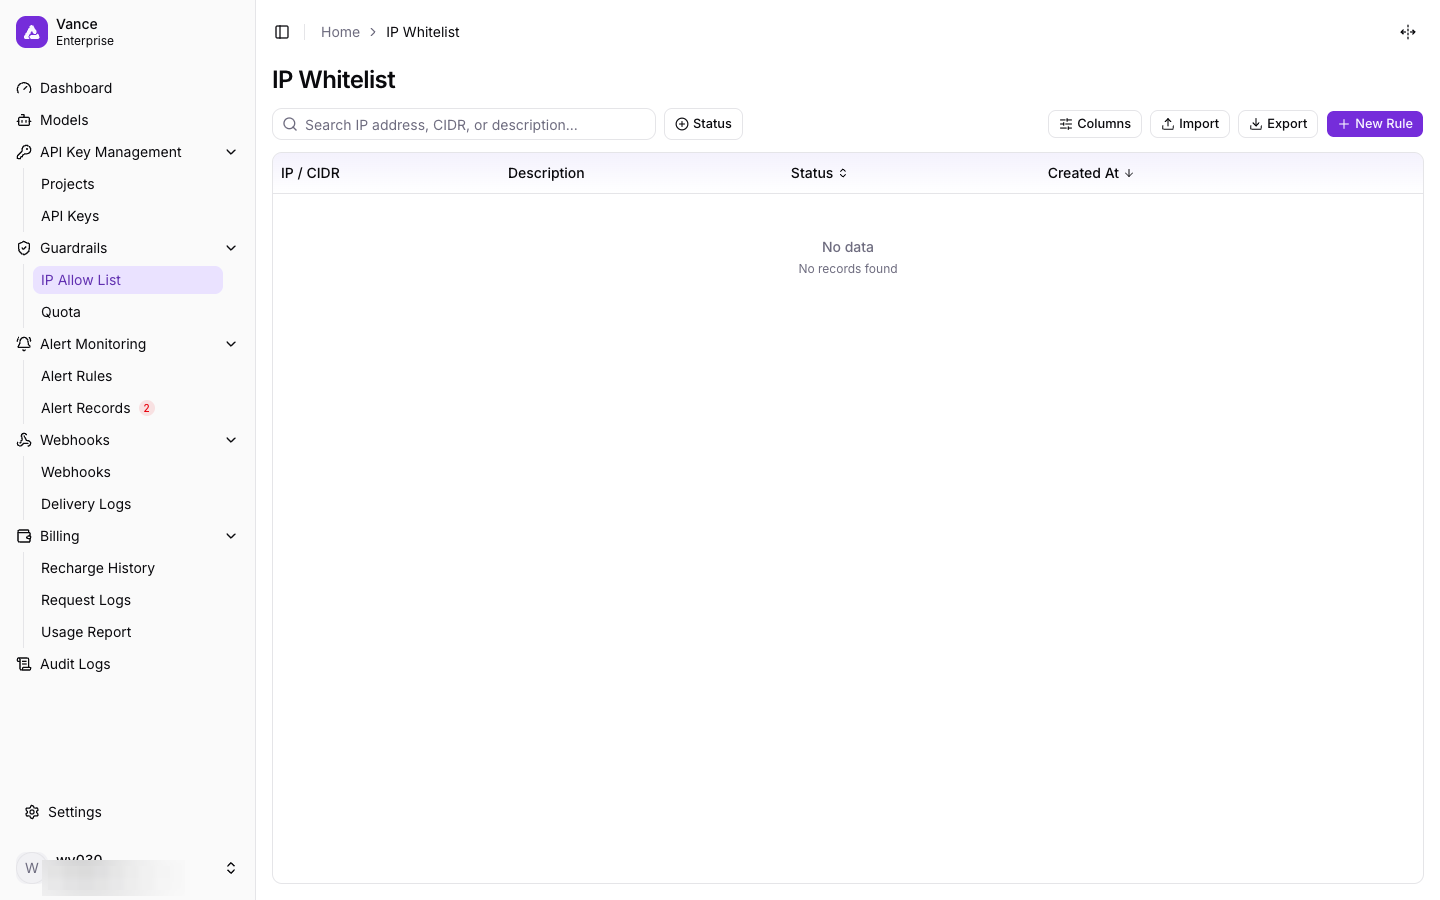
Figure 10: IP Whitelist page
Add a Rule
Click New Rule. Choose the Address Type (a single IP address or a CIDR range), enter the address and an optional description, then click Create.
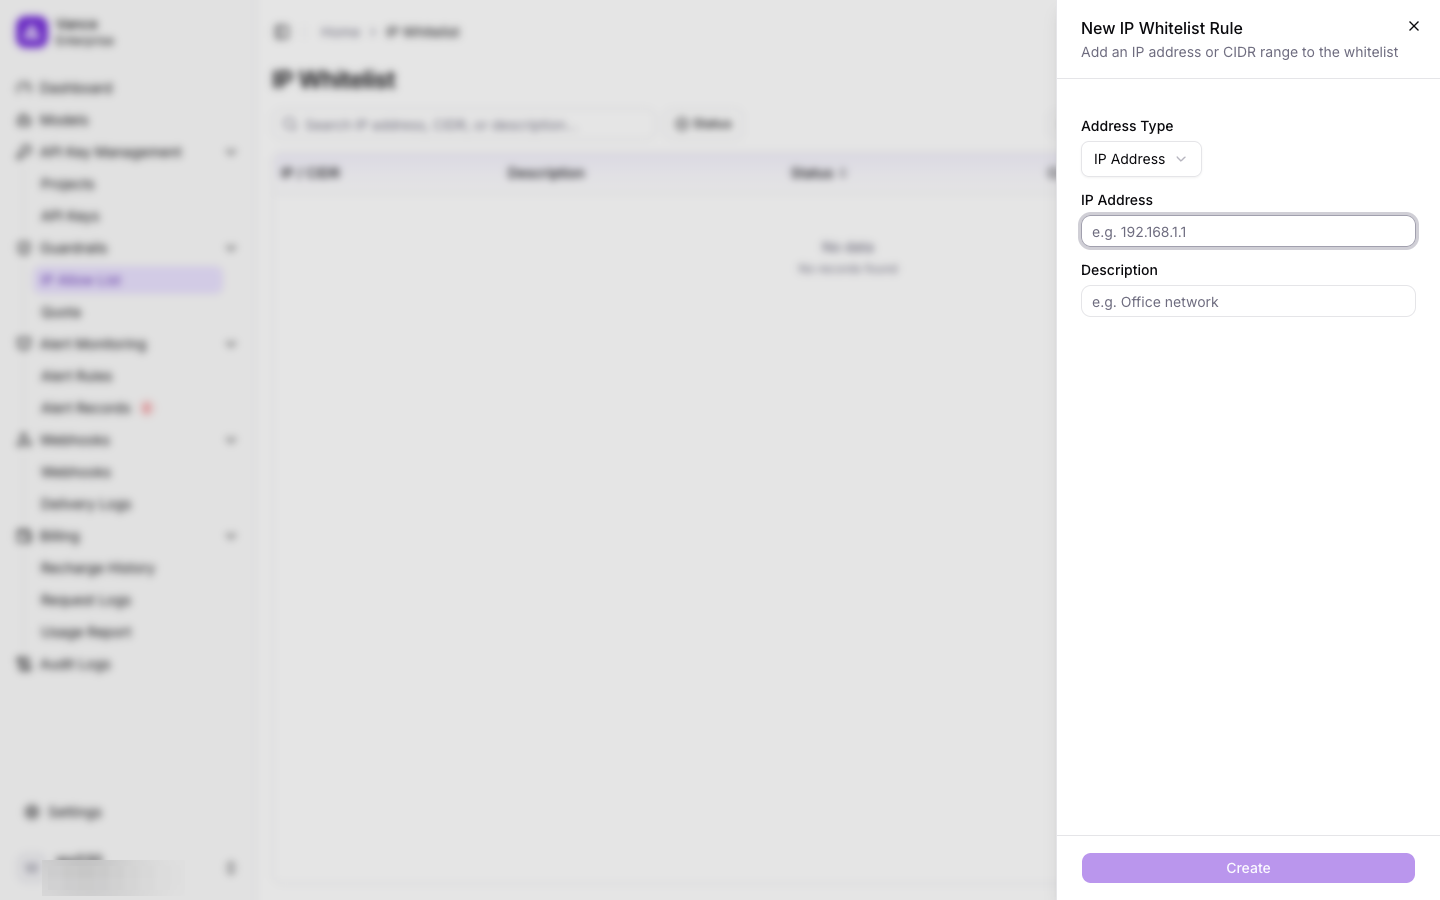
Figure 11: Add an IP Whitelist rule
Important: Before adding a whitelist, make sure your current IP is included; otherwise your API requests will be rejected.
7. Quota Management
Quota rules control and cap API spending to prevent unexpected costs. The Quota Rules page lists all rules with their subject type, scope, period, limit, and creation time.
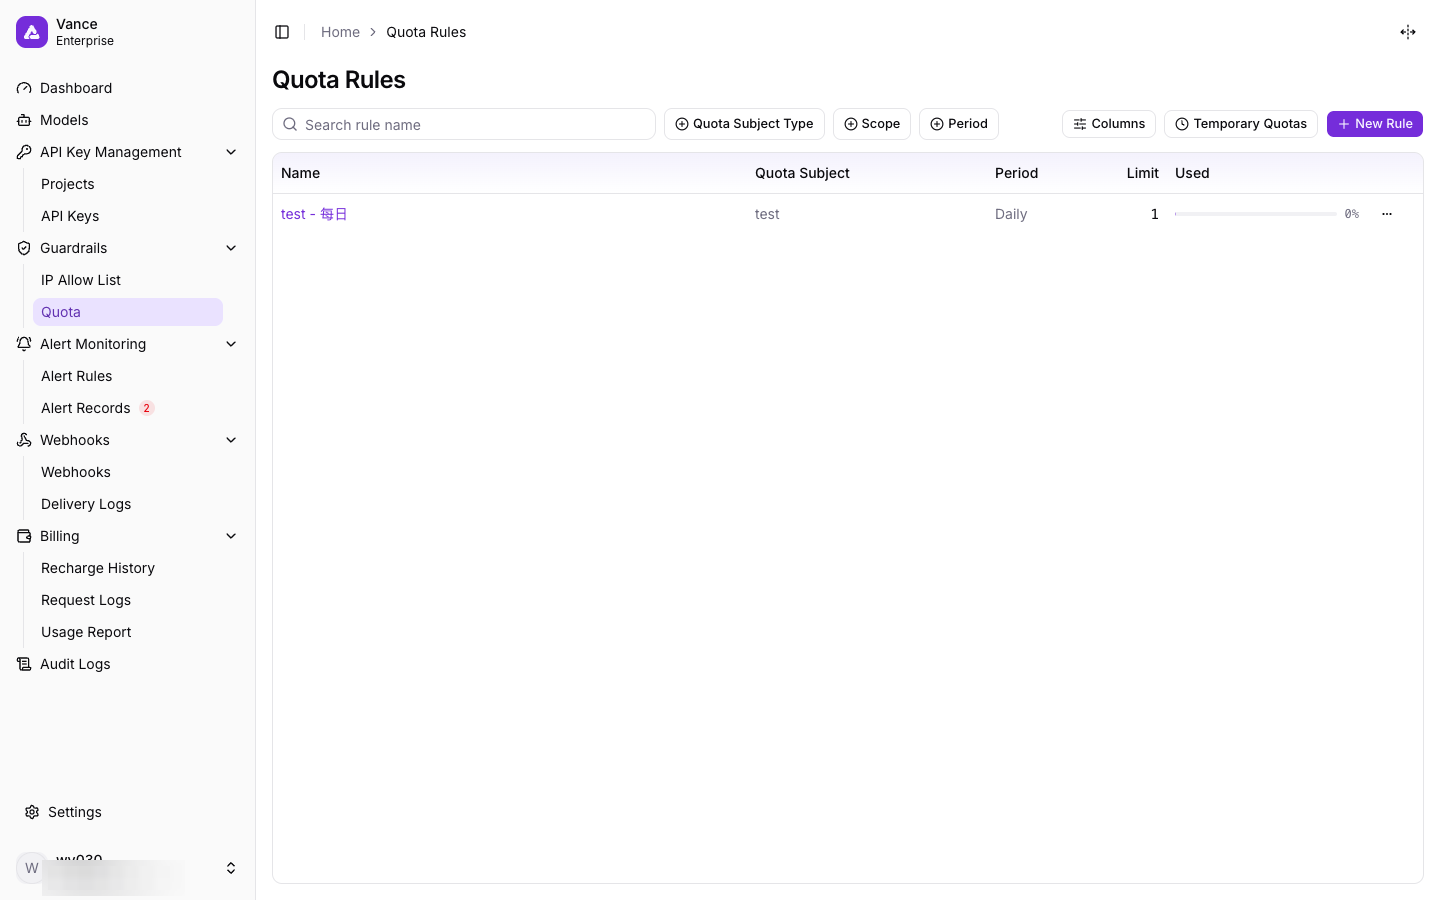
Figure 12: Quota Rules page
Create a Quota Rule
Click New Rule. Configure:
- Quota Subject Type — e.g. API Key.
- Scope — all subjects of that type, or a specific one (a type rule sets the default limit for all subjects of that type; a single-subject rule overrides it).
- Period — the reset cycle (e.g. Daily).
- Quota Limit (USD) — the maximum spend allowed per period; requests are rejected once exceeded.
- Rule Name — a display name for management and search.
Then click Create.
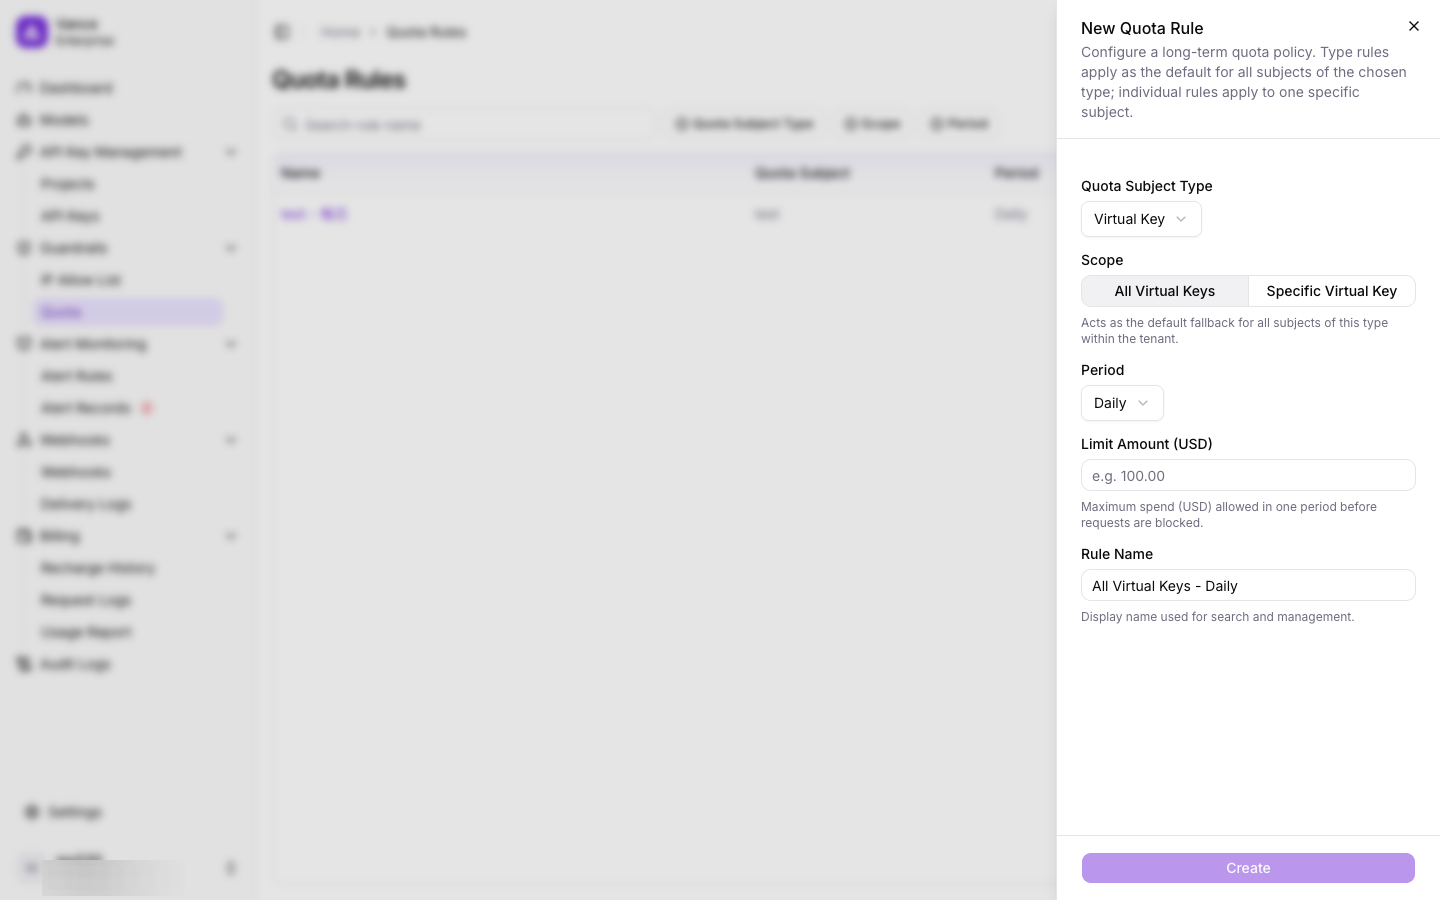
Figure 13: Create Quota Rule dialog
Temporary Quotas
Click Temporary Quotas to open the Quota Overrides page, where you can create short-term overrides (for example, a temporary spending increase for a campaign). Use New Override to add one.
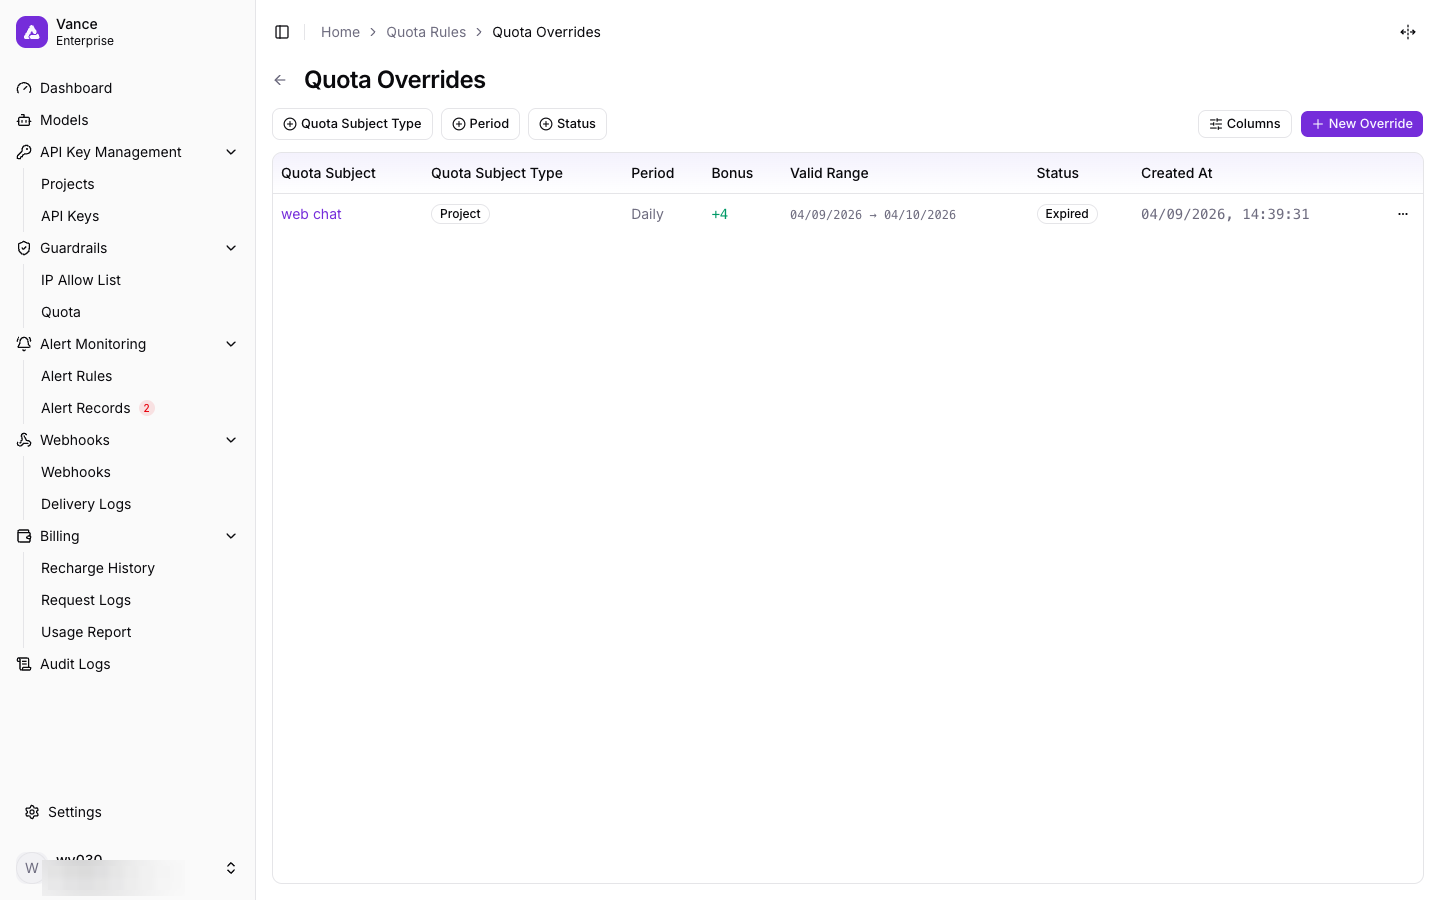
Figure 14: Temporary quotas (Quota Overrides)
8. Alert Monitoring
Alert Monitoring notifies you when key metrics cross configured thresholds. The Alert Rules page lists all rules.
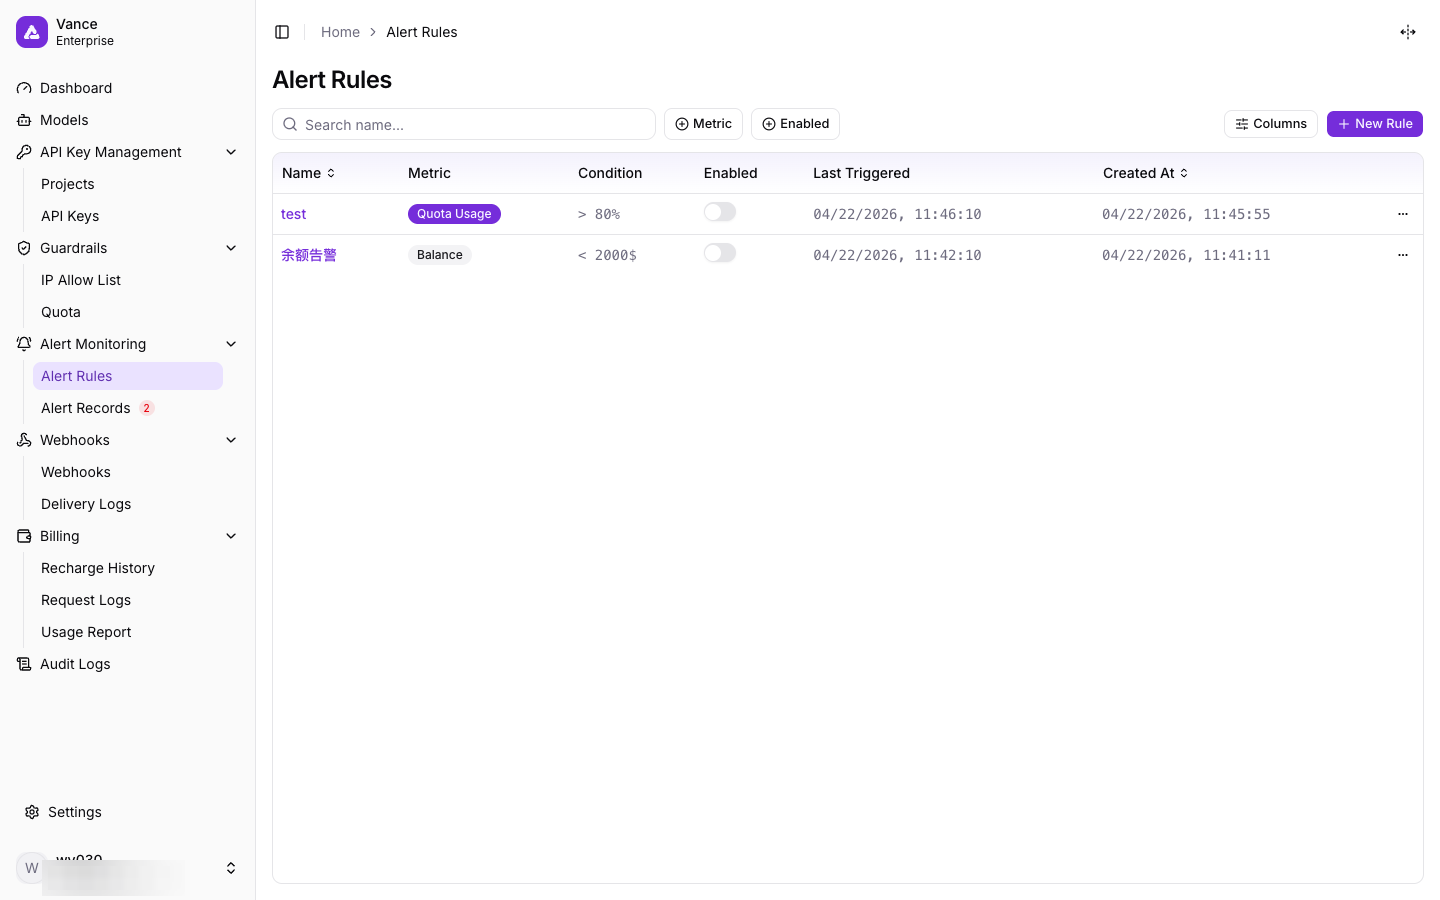
Figure 15: Alert Rules page
Create an Alert Rule
Click New Rule to open a two-step wizard.
Step 1 — Alert rule. Choose the Monitor Metric (e.g. quota usage percentage or prepaid balance), enter a Name, a Comparison Operator (e.g. >), the Threshold, and the Cooldown (minutes — the same rule only fires once per cooldown period). Click Next.
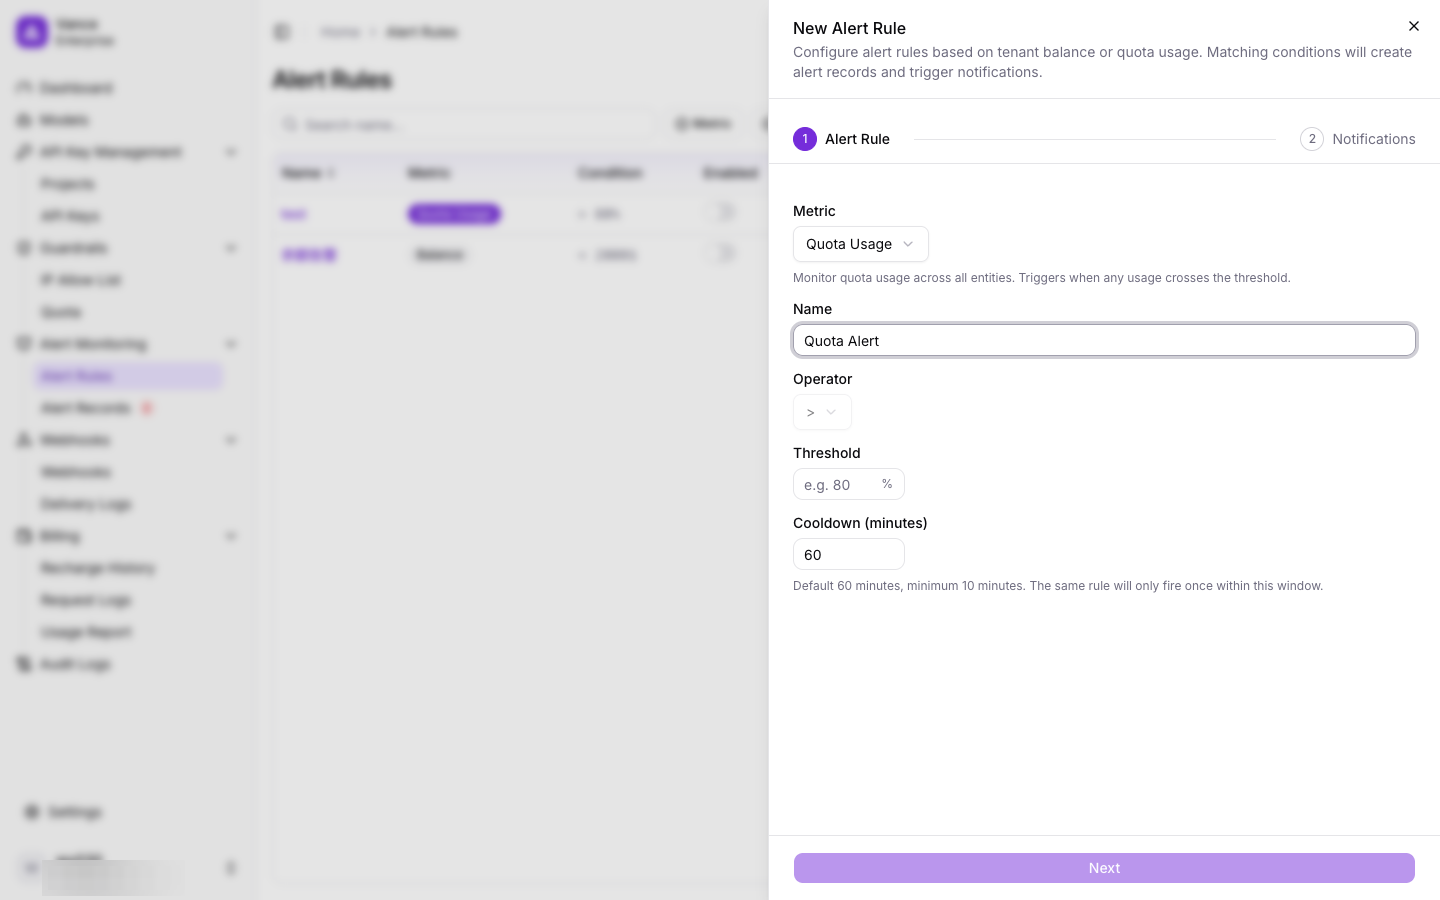
Figure 16: Create Alert Rule — Step 1
Step 2 — Notification channel. Choose how to be notified. You can create a new webhook (enter a name, type, URL, custom headers, and a payload template that supports variables such as ${ruleName}, ${triggerValue}, ${threshold}, ${viewLink}), test it, then click Complete. You may also Skip this step to only record the alert.
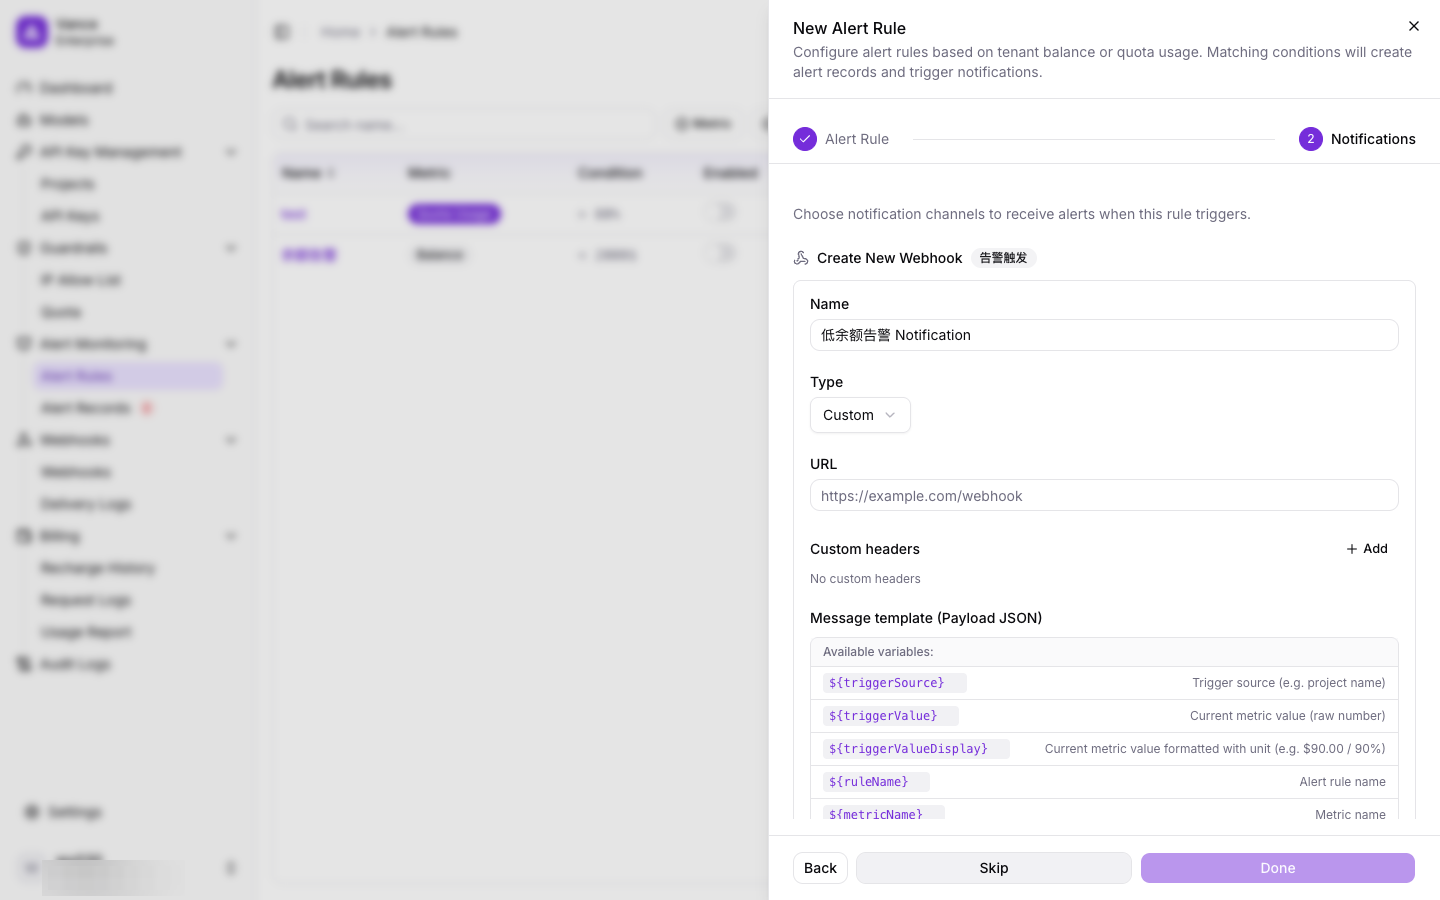
Figure 17: Create Alert Rule — Step 2 (notification channel)
Alert Records
The Alert Records page shows historical alerts with their metric, trigger time, status, and read state. Use Mark as Read / Mark Selected as Read to manage the read state.
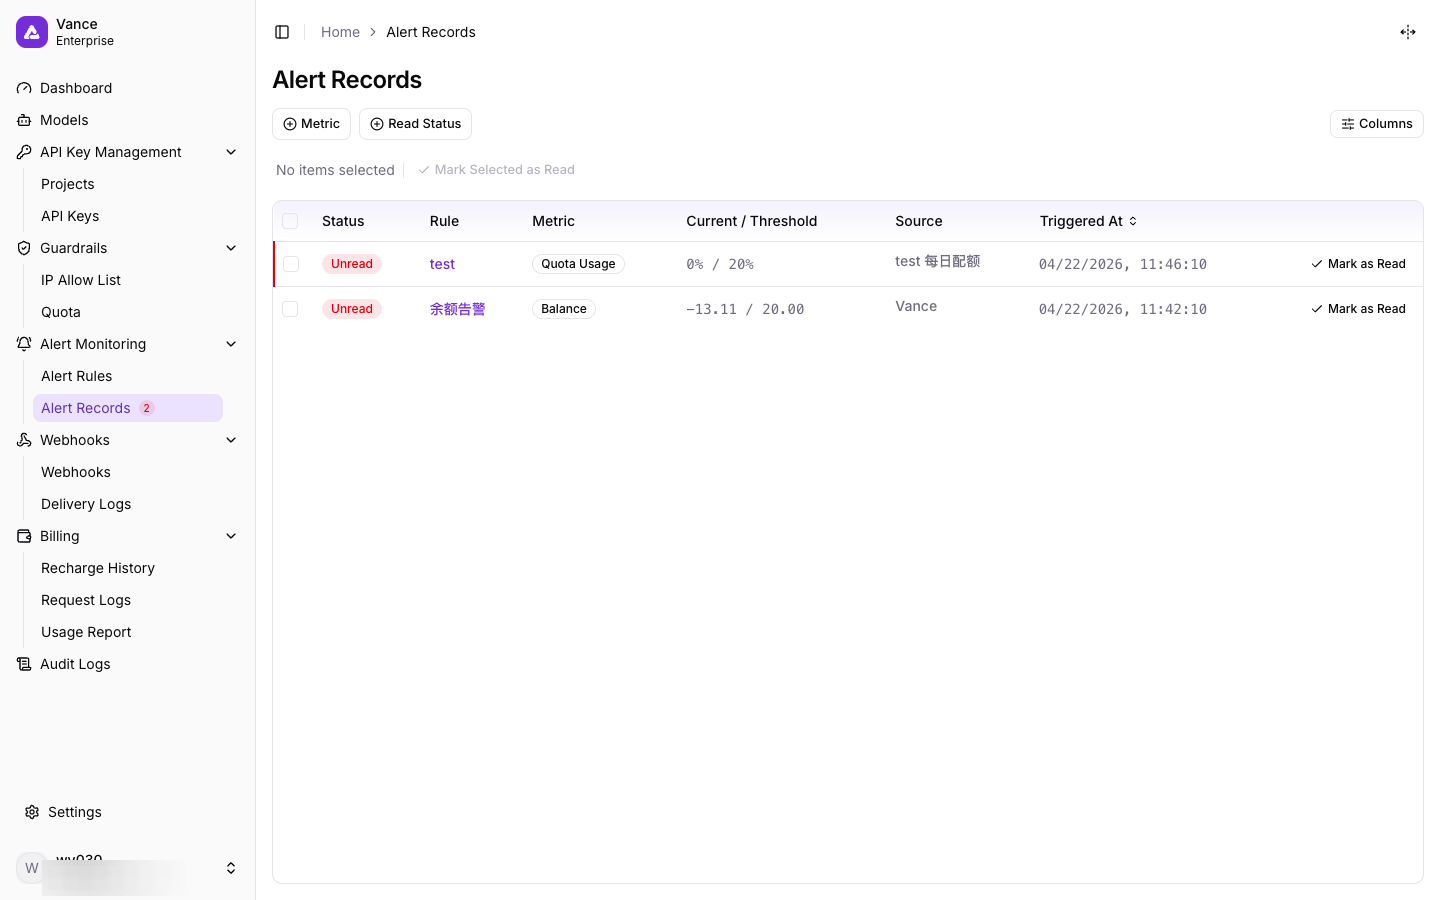
Figure 18: Alert Records page
9. Webhooks
Webhooks push events (alert triggers or API-request completion) to your HTTPS URL. The Webhooks page lists all configured webhooks.
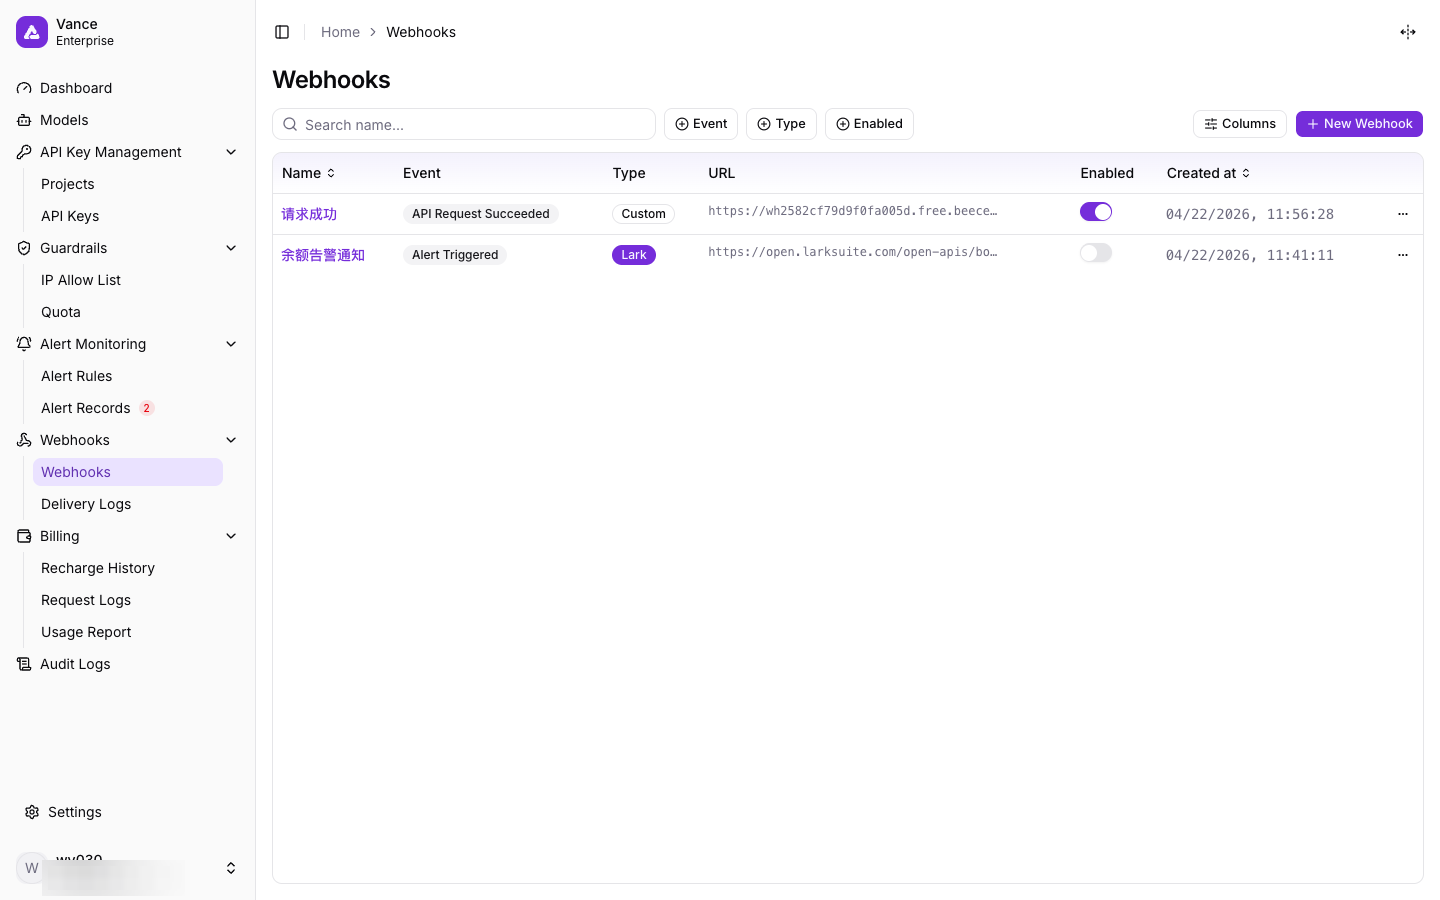
Figure 19: Webhooks page
Create a Webhook
Click New Webhook. Choose the Event, enter a Name, Type, and the URL (must be HTTPS), add optional custom headers, and define the Payload JSON template (use Restore preset template to reset it). Click Test Send to verify delivery, then Create.
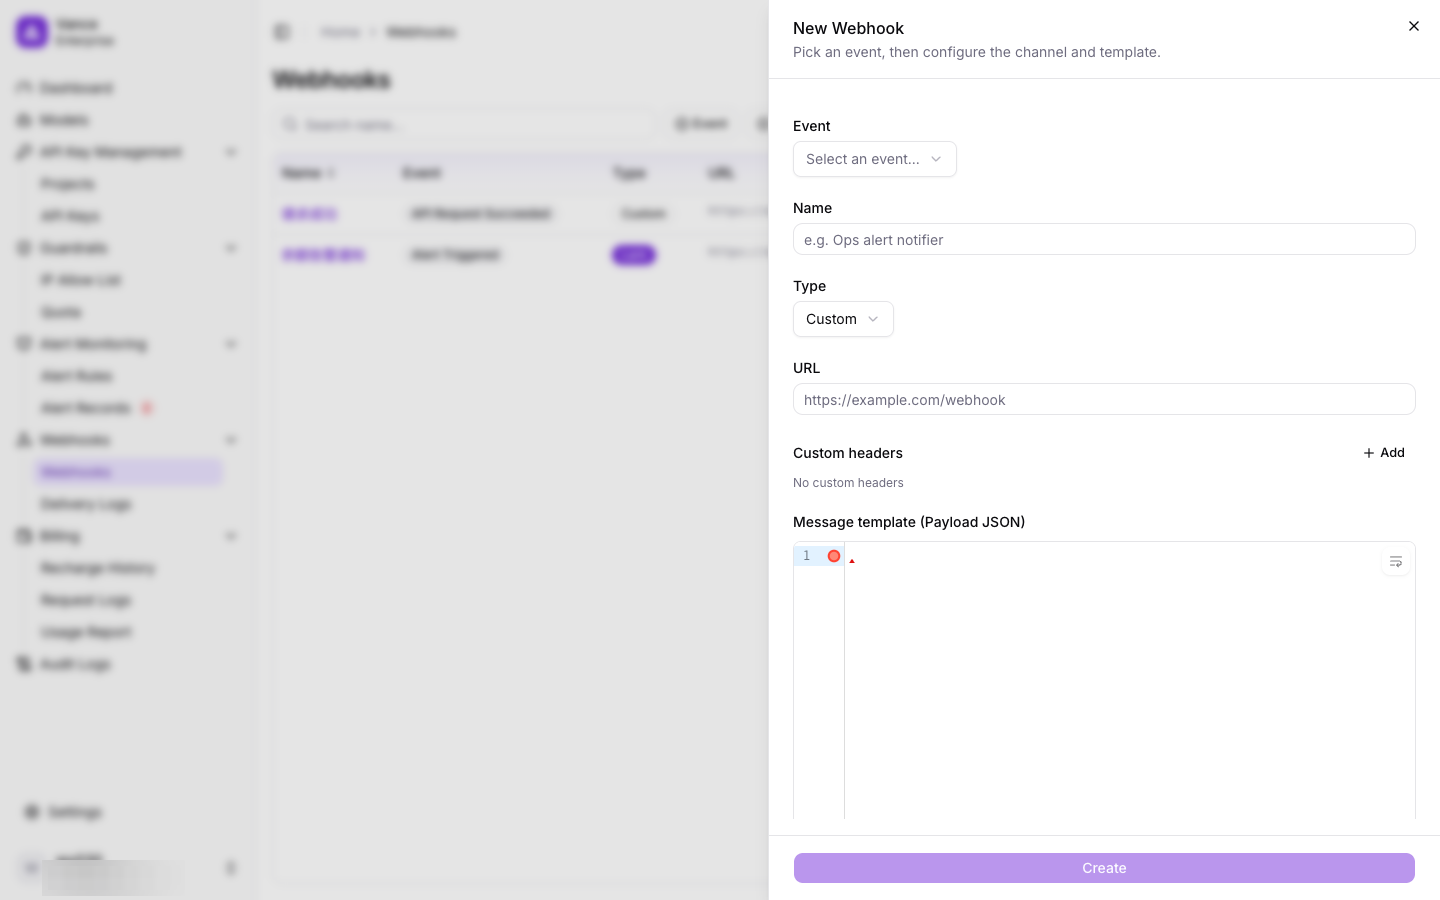
Figure 20: Create Webhook dialog
Delivery Logs
The Delivery Logs page records every delivery attempt with its status, target webhook, number of attempts, and delivery time.
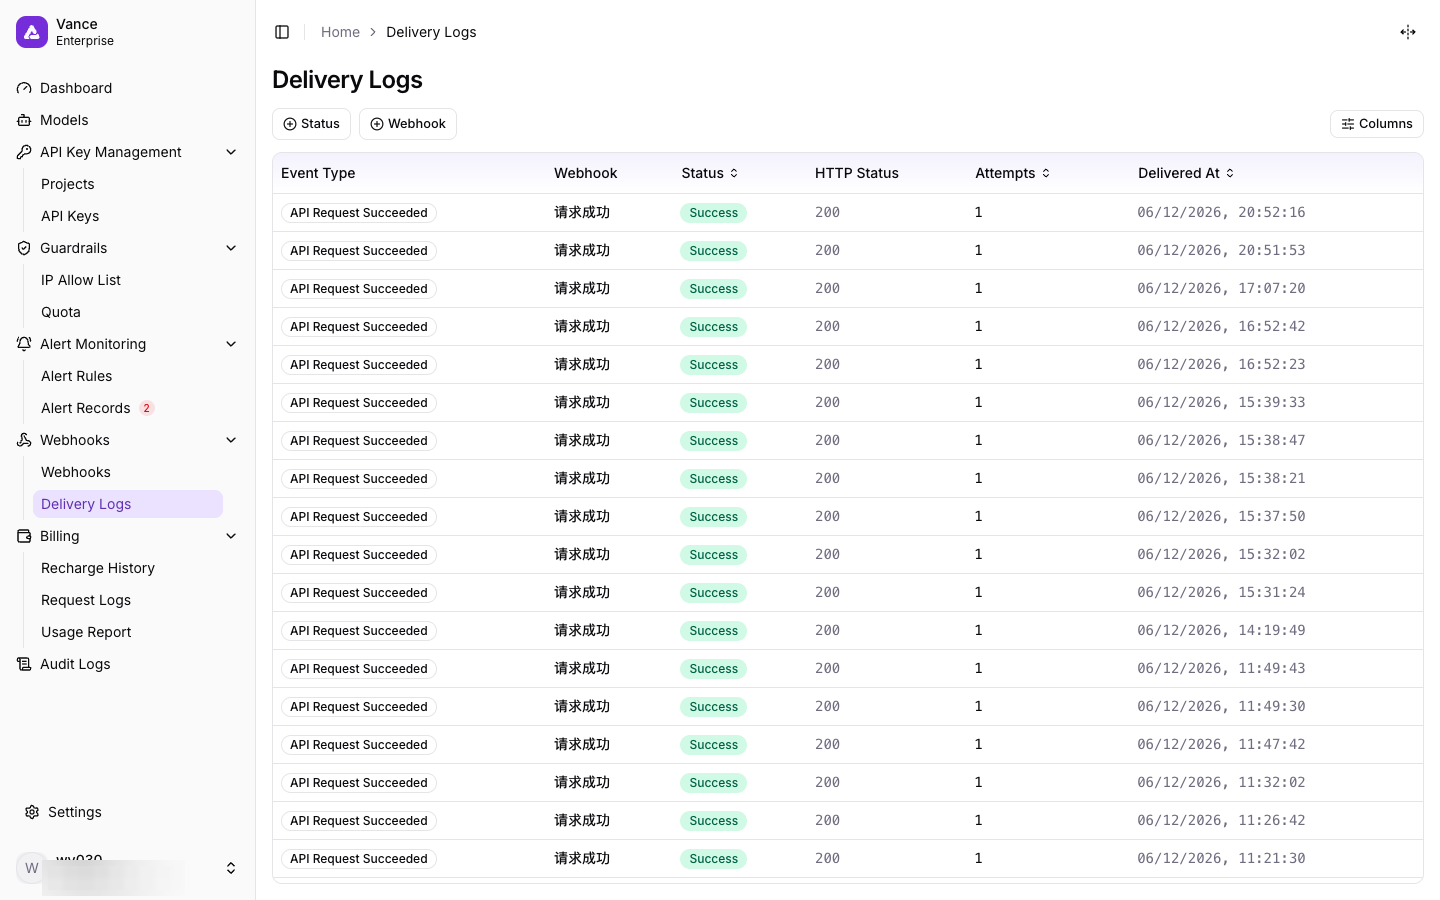
Figure 21: Webhook delivery logs
10. Billing Center
Recharge History
The Recharge History page lists all top-ups with the recharge amount (USD), the resulting balance (USD), and the creation time. Use Export to download the records.
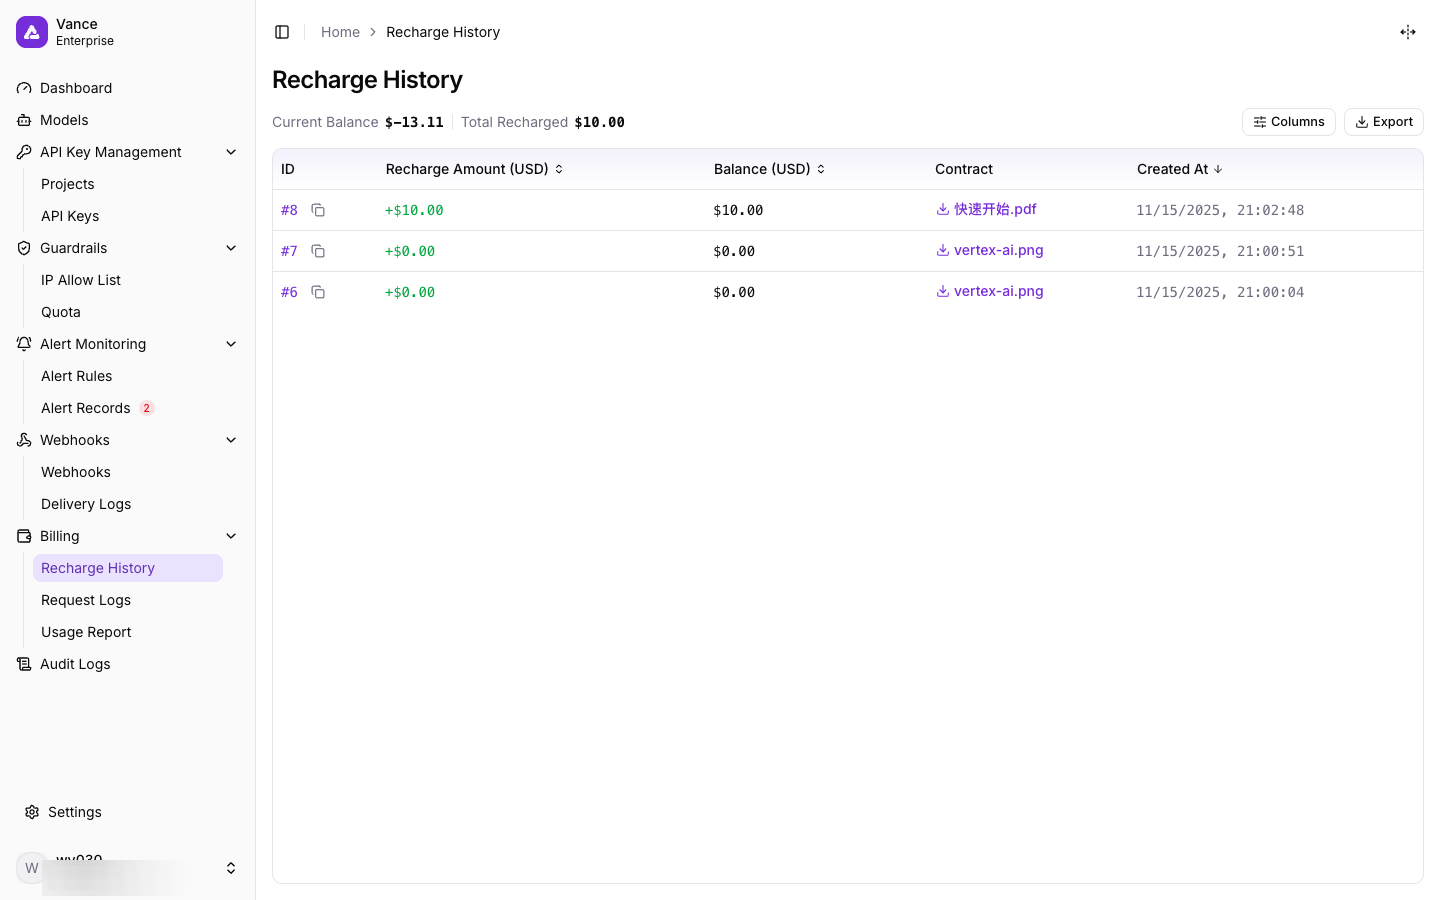
Figure 22: Recharge History page
Request Logs
The Request Logs page shows every API request with its time, total tokens, cost, and response time. Filter by date range, project, channel, and API Key, and use Refresh to reload.
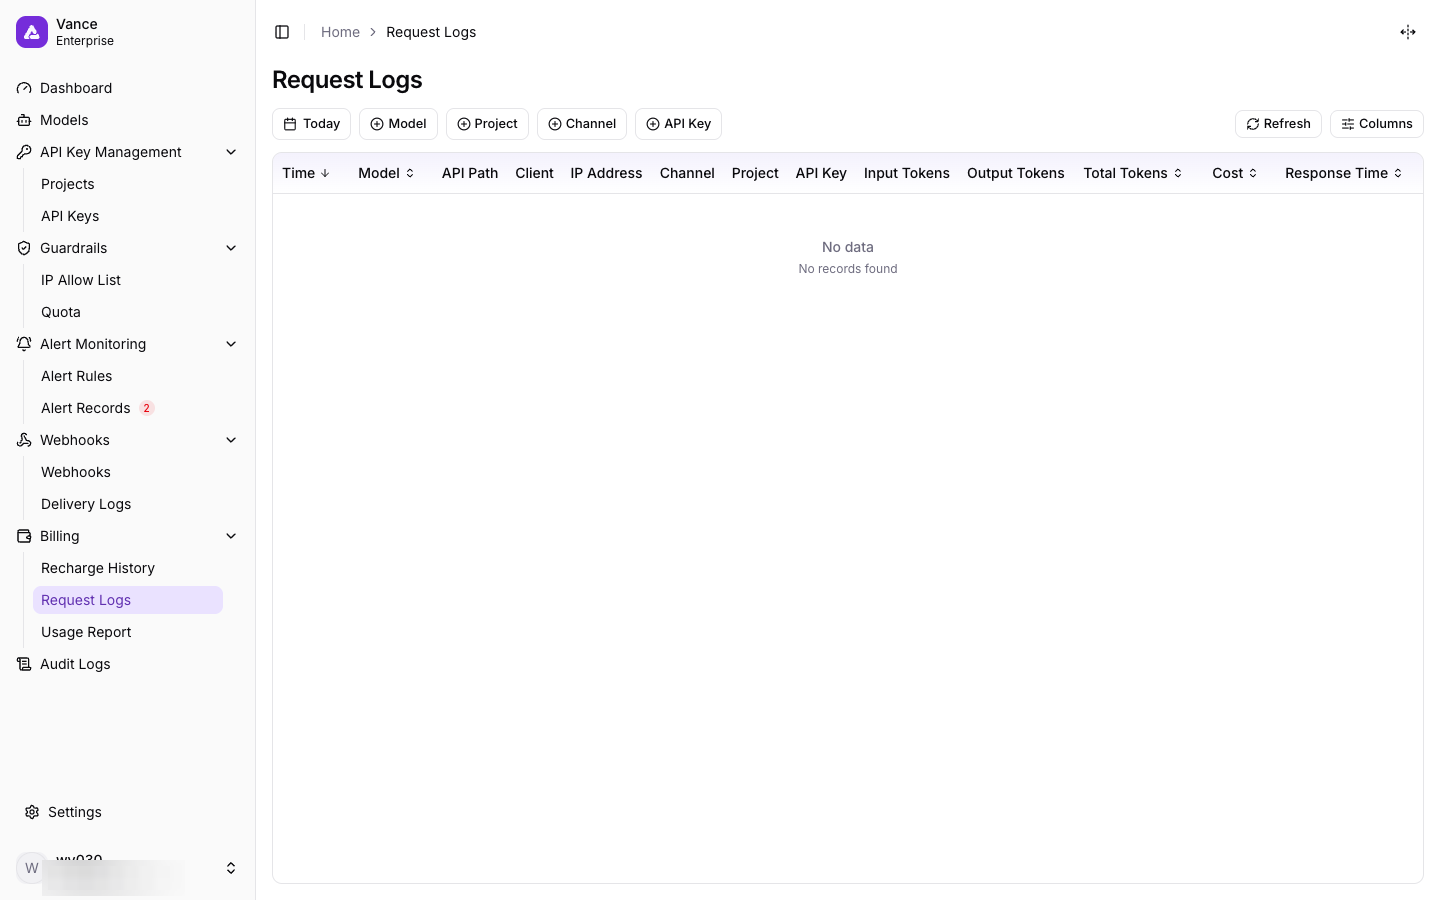
Figure 23: Request Logs page
Usage Report
The Usage Report page aggregates usage statistics. Pick a date range and dimensions, then view metrics (calls, input/output/total tokens, cost) grouped By Project / By Brand / By Model / By Key. Use Export to download the report.
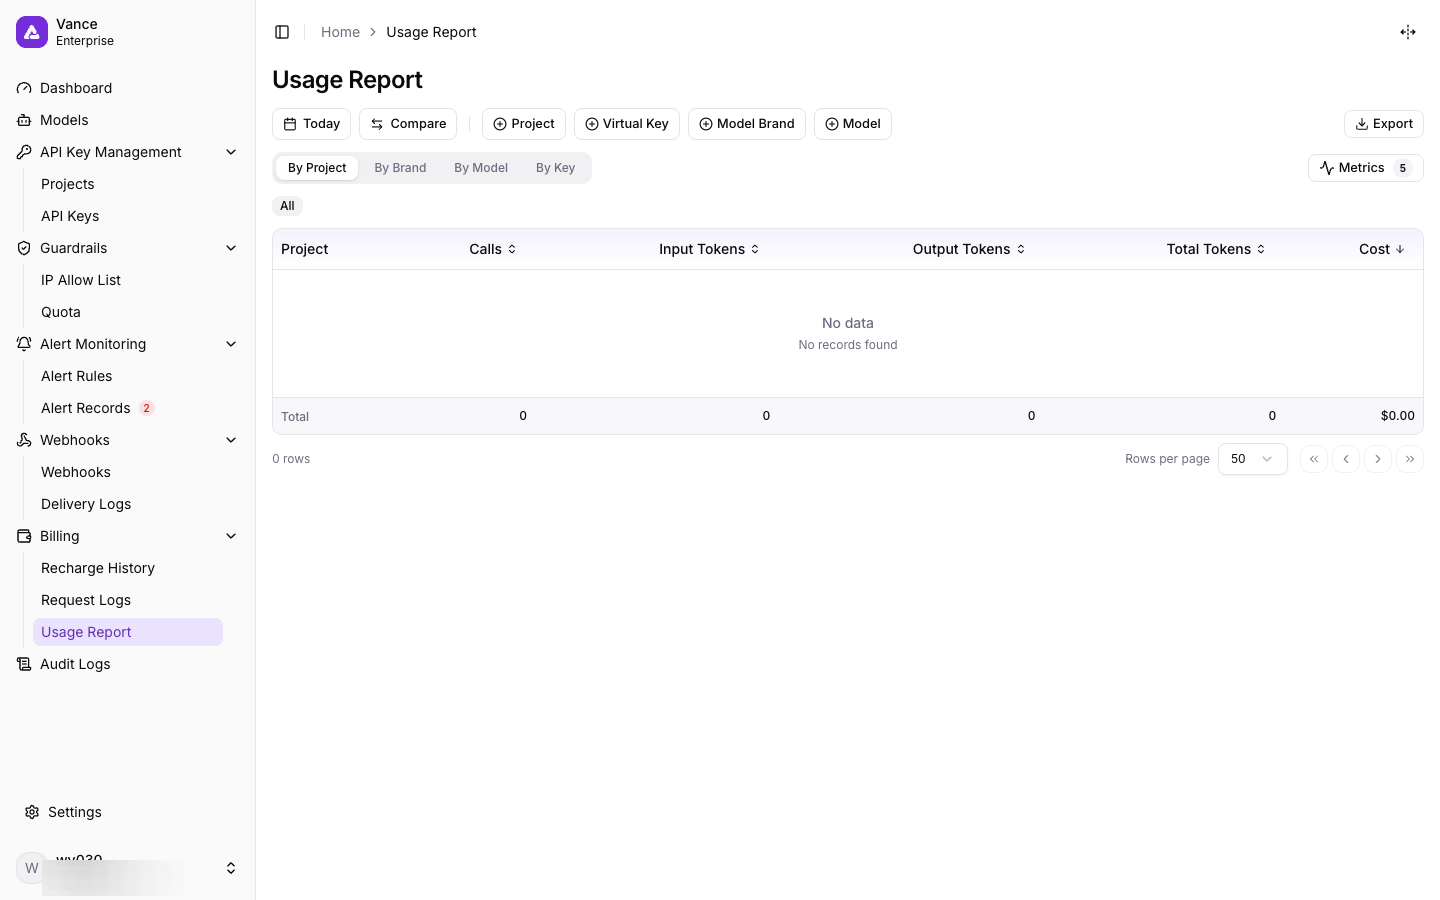
Figure 24: Usage Report page
11. Audit Logs
The Audit Logs page records console operations for traceability. Filter by date range, action, resource type, actor, and status; use Export or Refresh as needed.
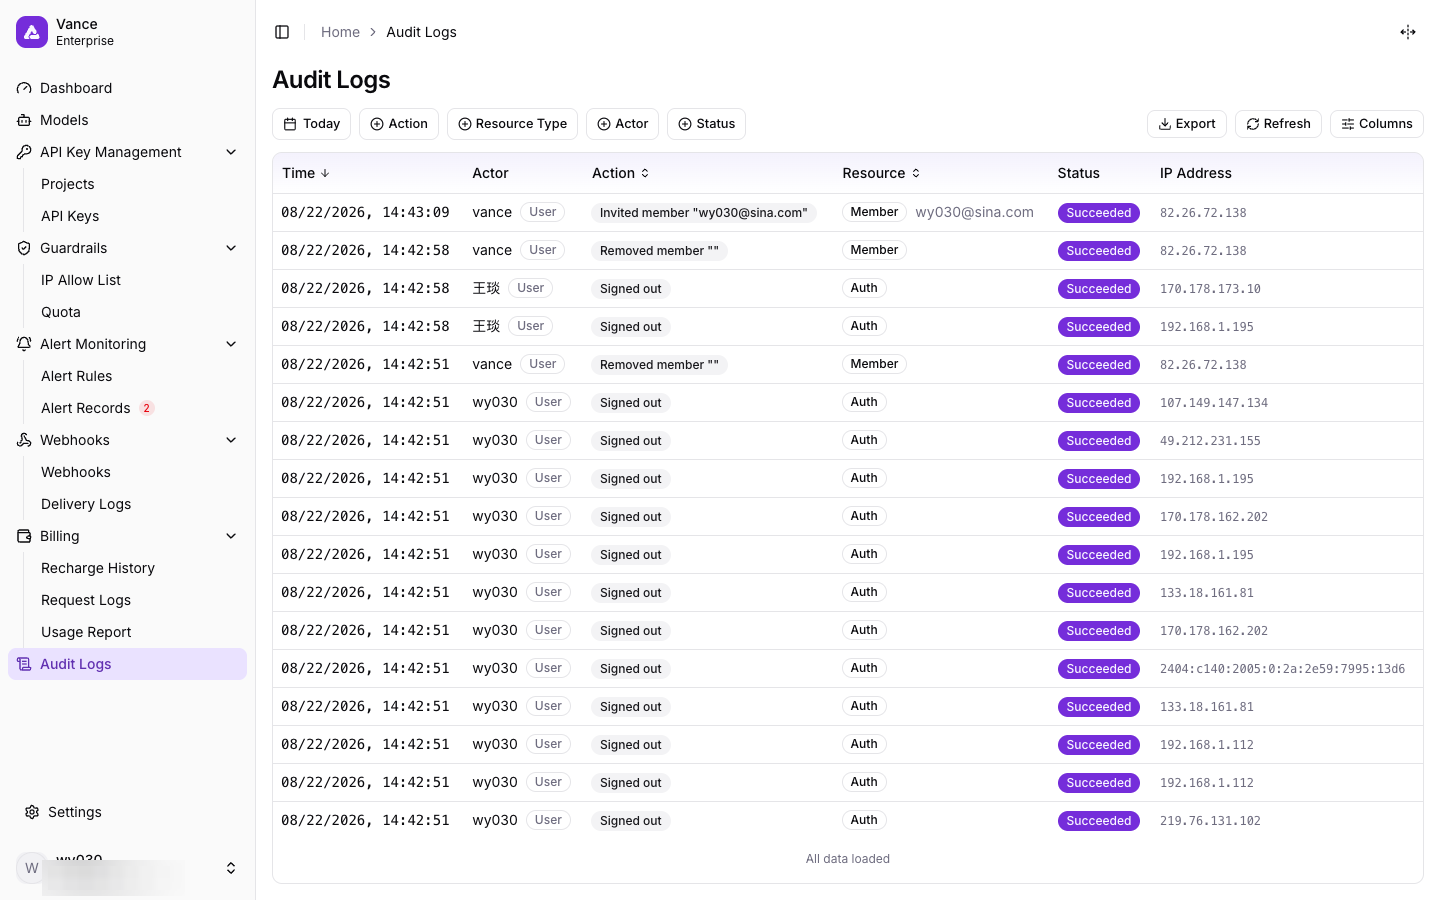
Figure 25: Audit Logs page
12. Account Settings
The Account Settings page lets you change the console Language (Chinese / English) and the Timezone. After changing, click Save; the page reloads in the new language.
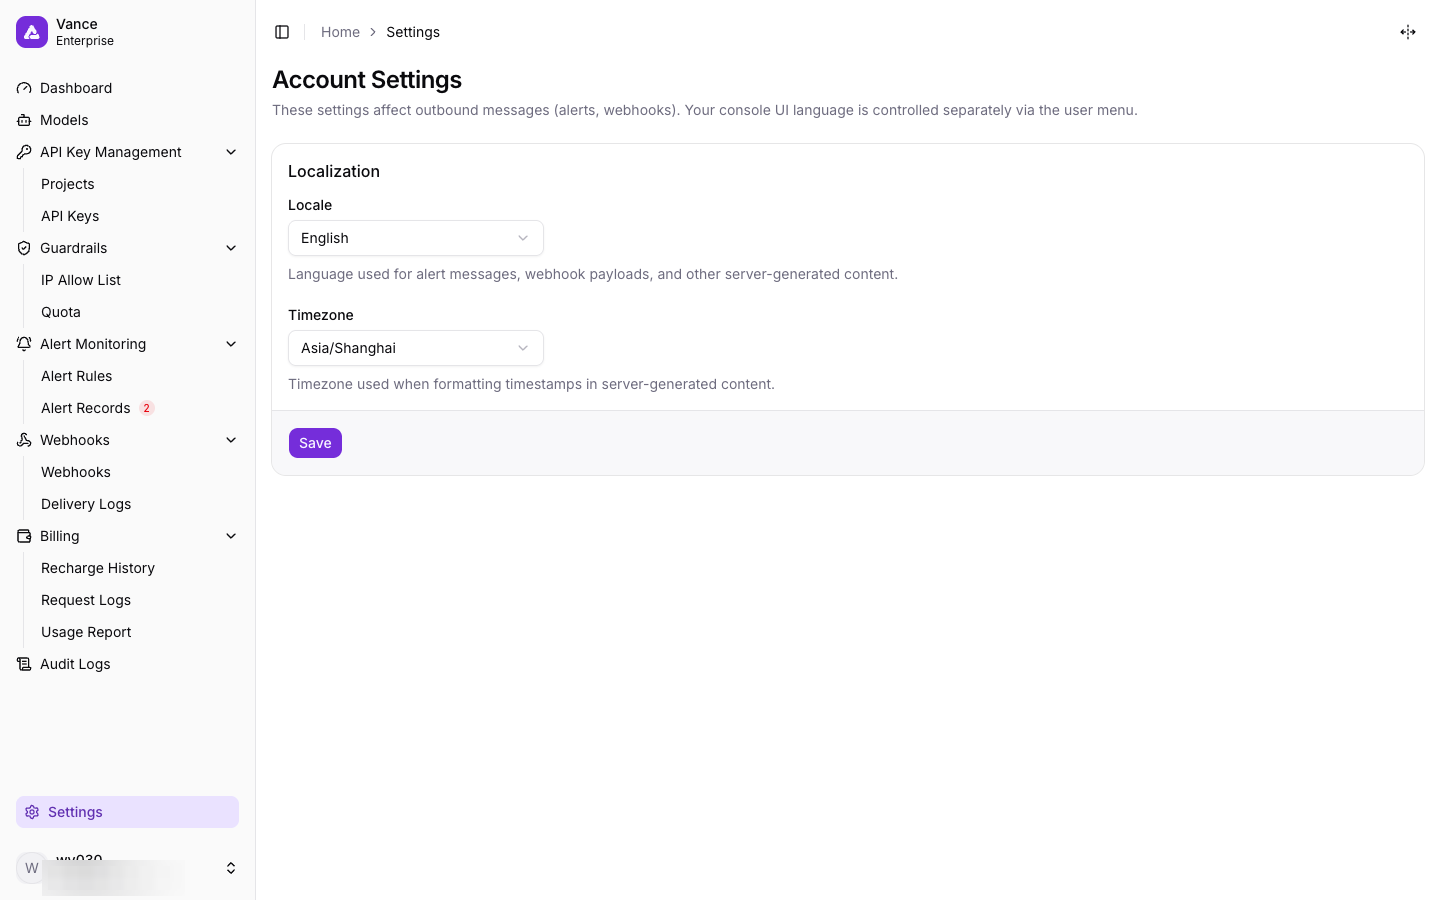
Figure 26: Account Settings (language & timezone)